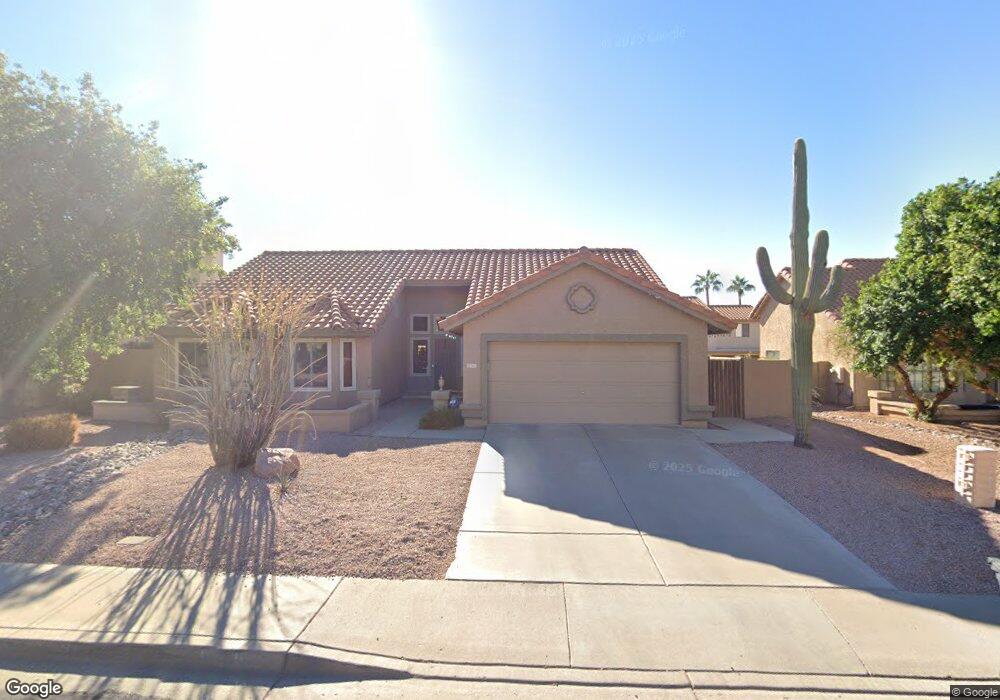
5927 E Fountain St Mesa, AZ 85205
Central Mesa East NeighborhoodEstimated Value: $419,765 - $533,000
3
Beds
3
Baths
1,844
Sq Ft
$270/Sq Ft
Est. Value
About This Home
This home is located at 5927 E Fountain St, Mesa, AZ 85205 and is currently estimated at $498,441, approximately $270 per square foot. 5927 E Fountain St is a home located in Maricopa County with nearby schools including Mendoza Elementary School, Franklin at Brimhall Elementary School, and Franklin West Elementary School.
Ownership History
Date
Name
Owned For
Owner Type
Purchase Details
Closed on
Aug 18, 2009
Sold by
Muscat David L
Bought by
Draper Lisa A
Current Estimated Value
Home Financials for this Owner
Home Financials are based on the most recent Mortgage that was taken out on this home.
Original Mortgage
$196,847
Outstanding Balance
$128,083
Interest Rate
5.17%
Mortgage Type
FHA
Estimated Equity
$370,358
Purchase Details
Closed on
Dec 3, 1997
Sold by
Bialas Ken
Bought by
Muscat David and Muscat Deborah
Purchase Details
Closed on
May 24, 1994
Sold by
Hartzler Samuel L
Bought by
Bialas Kenneth R and Bialas Kristy A
Home Financials for this Owner
Home Financials are based on the most recent Mortgage that was taken out on this home.
Original Mortgage
$111,600
Interest Rate
5.87%
Mortgage Type
New Conventional
Create a Home Valuation Report for This Property
The Home Valuation Report is an in-depth analysis detailing your home's value as well as a comparison with similar homes in the area
Home Values in the Area
Average Home Value in this Area
Purchase History
We collect this data history from publicly available records. To have your information removed, we recommend requesting removal directly through your county’s website.
| Date | Buyer | Sale Price | Title Company |
|---|---|---|---|
| Draper Lisa A | $200,500 | American Title Service Agenc | |
| Muscat David | $129,250 | First American Title | |
| Bialas Kenneth R | $124,000 | Chicago Title Insurance Co |
Source: Public Records
Mortgage History
We collect this data history from publicly available records. To have your information removed, we recommend requesting removal directly through your county’s website.
| Date | Status | Borrower | Loan Amount |
|---|---|---|---|
| Open | Draper Lisa A | $196,847 | |
| Previous Owner | Bialas Kenneth R | $111,600 |
Source: Public Records
Tax History
| Year | Tax Paid | Tax Assessment Tax Assessment Total Assessment is a certain percentage of the fair market value that is determined by local assessors to be the total taxable value of land and additions on the property. | Land | Improvement |
|---|---|---|---|---|
| 2025 | $1,962 | $23,630 | -- | -- |
| 2024 | $1,984 | $22,505 | -- | -- |
| 2023 | $1,984 | $36,980 | $7,390 | $29,590 |
| 2022 | $1,940 | $27,870 | $5,570 | $22,300 |
| 2021 | $1,993 | $25,230 | $5,040 | $20,190 |
| 2020 | $1,967 | $23,550 | $4,710 | $18,840 |
| 2019 | $1,822 | $22,080 | $4,410 | $17,670 |
| 2018 | $1,740 | $20,320 | $4,060 | $16,260 |
| 2017 | $1,685 | $19,670 | $3,930 | $15,740 |
| 2016 | $1,654 | $19,320 | $3,860 | $15,460 |
| 2015 | $1,562 | $18,380 | $3,670 | $14,710 |
Source: Public Records
Map
Nearby Homes
- 1107 N 59th St Unit 5A
- 6037 E Evergreen St
- 6051 E Ensenada St
- 1258 N Recker Rd Unit 6
- 5950 E Adobe Rd Unit 1 - 38
- 5808 E Brown Rd Unit 7
- 5808 E Brown Rd Unit 36
- 5808 E Brown Rd Unit 143
- 5808 E Brown Rd Unit 90
- 6058 E El Paso St
- 1340 N Recker Rd Unit 210
- 1340 N Recker Rd Unit 140
- 1340 N Recker Rd Unit 256
- 5853 E Adobe Rd
- 5862 E Duncan St
- 5822 E Duncan St
- 6044 E Glencove St
- 5903 E Duncan St
- 5847 E Duncan St
- 5915 E Duncan St
- 5926 E Fairfield St
- 5910 E Fairfield St
- 5919 E Fountain St
- 5911 E Fountain St
- 5902 E Fairfield St Unit 5A
- 5934 E Fairfield St Unit 5A
- 5915 E Fairfield St Unit 5A
- 5857 E Fountain St
- 5935 E Fountain St
- 5923 E Fairfield St
- 1033 N 59th St
- 5931 E Fairfield St
- 5955 E Fountain St
- 5850 E Fairfield St Unit 5A
- 5849 E Fountain St
- 1025 N 59th St
- 5939 E Fairfield St
- 5924 E Fountain St
- 5946 E Fairfield St
- 5842 E Fairfield St
Your Personal Tour Guide
Ask me questions while you tour the home.