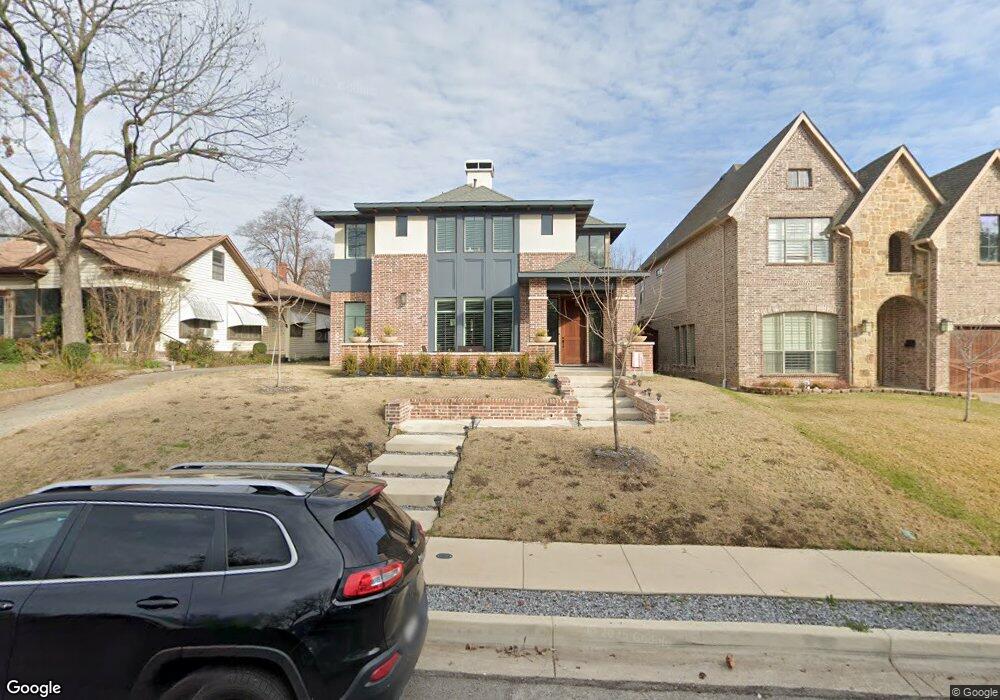
5927 Prospect Ave Dallas, TX 75206
Lower Greenville NeighborhoodEstimated Value: $1,339,000 - $1,551,000
4
Beds
5
Baths
3,580
Sq Ft
$403/Sq Ft
Est. Value
About This Home
This home is located at 5927 Prospect Ave, Dallas, TX 75206 and is currently estimated at $1,442,661, approximately $402 per square foot. 5927 Prospect Ave is a home with nearby schools including J L Long Middle School, Woodrow Wilson High School, and Lakehill Preparatory School.
Ownership History
Date
Name
Owned For
Owner Type
Purchase Details
Closed on
Sep 12, 2016
Sold by
Mccoll Cassandra and Mccoll Arch
Bought by
Samuelson Richard Thomas
Current Estimated Value
Home Financials for this Owner
Home Financials are based on the most recent Mortgage that was taken out on this home.
Original Mortgage
$229,500
Outstanding Balance
$65,106
Interest Rate
3.43%
Mortgage Type
Commercial
Estimated Equity
$1,377,555
Purchase Details
Closed on
May 16, 2008
Sold by
Mccoll Arch
Bought by
Mccoll Cassandra
Purchase Details
Closed on
Aug 8, 2002
Sold by
Bivens John W
Bought by
Mccoll Arch and Mccoll Cassandra
Purchase Details
Closed on
Jun 30, 2000
Sold by
Molina David
Bought by
Bivens John W
Purchase Details
Closed on
Sep 28, 1998
Sold by
Molina Gilda
Bought by
Molina David
Home Financials for this Owner
Home Financials are based on the most recent Mortgage that was taken out on this home.
Original Mortgage
$12,500
Interest Rate
6.81%
Mortgage Type
Seller Take Back
Create a Home Valuation Report for This Property
The Home Valuation Report is an in-depth analysis detailing your home's value as well as a comparison with similar homes in the area
Home Values in the Area
Average Home Value in this Area
Purchase History
| Date | Buyer | Sale Price | Title Company |
|---|---|---|---|
| Samuelson Richard Thomas | -- | Lawyers Title | |
| Mccoll Cassandra | -- | None Available | |
| Mccoll Arch | -- | -- | |
| Bivens John W | -- | -- | |
| Molina David | -- | -- |
Source: Public Records
Mortgage History
| Date | Status | Borrower | Loan Amount |
|---|---|---|---|
| Open | Samuelson Richard Thomas | $229,500 | |
| Previous Owner | Molina David | $12,500 |
Source: Public Records
Tax History Compared to Growth
Tax History
| Year | Tax Paid | Tax Assessment Tax Assessment Total Assessment is a certain percentage of the fair market value that is determined by local assessors to be the total taxable value of land and additions on the property. | Land | Improvement |
|---|---|---|---|---|
| 2025 | $21,259 | $1,547,480 | $493,570 | $1,053,910 |
| 2024 | $21,259 | $1,547,480 | $493,570 | $1,053,910 |
| 2023 | $21,259 | $1,071,790 | $358,940 | $712,850 |
| 2022 | $26,799 | $1,071,790 | $358,940 | $712,850 |
| 2021 | $26,830 | $1,017,060 | $358,940 | $658,120 |
| 2020 | $27,592 | $1,017,060 | $358,940 | $658,120 |
| 2019 | $28,938 | $1,017,060 | $358,940 | $658,120 |
| 2018 | $12,507 | $459,950 | $312,130 | $147,820 |
| 2017 | $7,275 | $267,540 | $267,540 | $0 |
| 2016 | $5,982 | $220,000 | $220,000 | $0 |
| 2015 | $4,114 | $220,000 | $220,000 | $0 |
| 2014 | $4,114 | $150,000 | $150,000 | $0 |
Source: Public Records
Map
Nearby Homes
- 6003 Oram St Unit 104
- 6003 Oram St Unit 106
- 5828 Prospect Ave
- 5839 Richmond Ave
- 6039 Prospect Ave
- 6036 Richmond Ave
- 6038 Prospect Ave
- 5919 Belmont Ave
- 5838 La Vista Dr
- 6001 Lewis St Unit 102
- 1844 Mecca St
- 5963 Ross Ave Unit 202
- 5851 La Vista Ct
- 5830 La Vista Ct
- 5909 Ross Ave Unit 2
- 5875 Ross Ave Unit 6
- 5705 Live Oak St Unit B
- 5609 Lewis St
- 5713 La Vista Dr
- 1909 Hope Way
- 5921 Prospect Ave
- 5923 Prospect Ave
- 5917 Prospect Ave
- 5935.5 Prospect Ave Unit Upper
- 5935 Prospect Ave
- 5915 Prospect Ave
- 5939 Prospect Ave
- 5909 Prospect Ave
- 5928 Richmond Ave
- 5943 Prospect Ave
- 5922 Richmond Ave
- 5930 Richmond Ave
- 5926 Prospect Ave
- 5922 Prospect Ave
- 5930 Prospect Ave
- 5918 Richmond Ave
- 5936 Prospect Ave Unit REAR H
- 5936 Prospect Ave Unit Rear
- 5936 Prospect Ave
- 5932 Richmond Ave