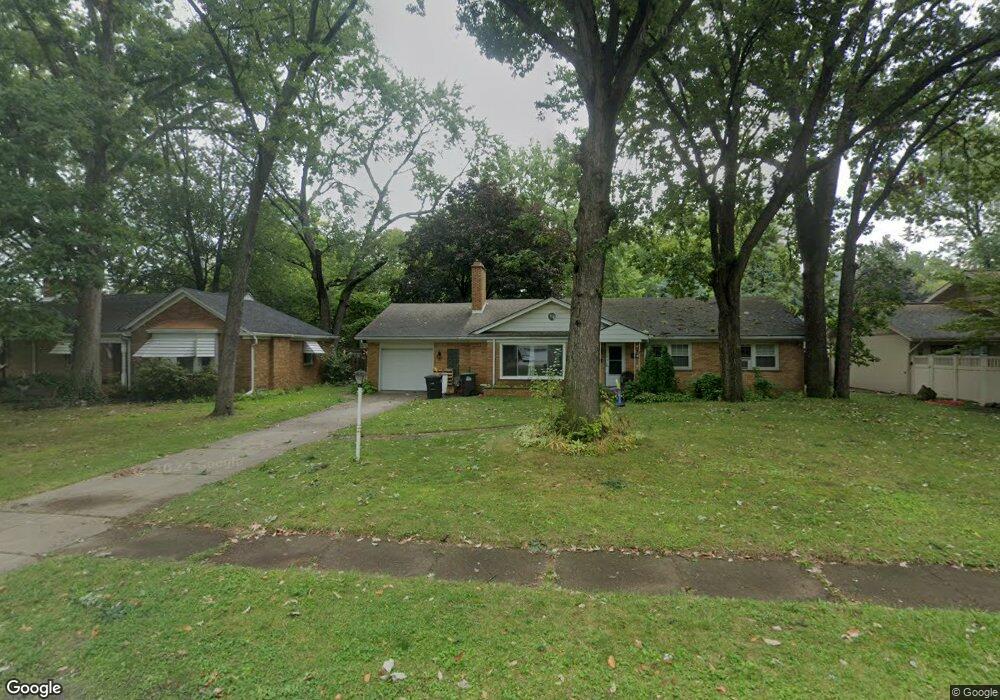
5927 Syracuse St Taylor, MI 48180
Estimated Value: $201,000 - $226,827
3
Beds
2
Baths
1,596
Sq Ft
$134/Sq Ft
Est. Value
About This Home
This home is located at 5927 Syracuse St, Taylor, MI 48180 and is currently estimated at $214,207, approximately $134 per square foot. 5927 Syracuse St is a home located in Wayne County with nearby schools including Taylor Parks Elementary School, Hoover Middle School, and Quest Charter Academy.
Ownership History
Date
Name
Owned For
Owner Type
Purchase Details
Closed on
Dec 17, 2018
Sold by
Holt Timothy Harmon and Holt Beverly
Bought by
Zielinski Justin J
Current Estimated Value
Home Financials for this Owner
Home Financials are based on the most recent Mortgage that was taken out on this home.
Original Mortgage
$101,600
Outstanding Balance
$81,468
Interest Rate
4.8%
Mortgage Type
New Conventional
Estimated Equity
$132,739
Purchase Details
Closed on
Jan 6, 2009
Sold by
Holt Harmon and Holt Beverly
Bought by
Holt Harmon
Purchase Details
Closed on
Aug 1, 2007
Sold by
Mortgage Electronic Registration Systems
Bought by
Deutsche Bank Trust Co America
Purchase Details
Closed on
Jul 18, 2007
Sold by
Justice Ss Hillman and Justice Elizabeth
Bought by
Mortgage Electronic Registration Systems
Purchase Details
Closed on
Mar 11, 2004
Sold by
Bara Sherry A and Bara Patrick J
Bought by
Jp Morgan Chase Bank
Create a Home Valuation Report for This Property
The Home Valuation Report is an in-depth analysis detailing your home's value as well as a comparison with similar homes in the area
Home Values in the Area
Average Home Value in this Area
Purchase History
| Date | Buyer | Sale Price | Title Company |
|---|---|---|---|
| Zielinski Justin J | $127,000 | Michigan Title Ins Agency In | |
| Holt Harmon | -- | None Available | |
| Deutsche Bank Trust Co America | -- | E Title Agency | |
| Mortgage Electronic Registration Systems | $131,235 | None Available | |
| Jp Morgan Chase Bank | $142,201 | -- |
Source: Public Records
Mortgage History
| Date | Status | Borrower | Loan Amount |
|---|---|---|---|
| Open | Zielinski Justin J | $101,600 |
Source: Public Records
Tax History Compared to Growth
Tax History
| Year | Tax Paid | Tax Assessment Tax Assessment Total Assessment is a certain percentage of the fair market value that is determined by local assessors to be the total taxable value of land and additions on the property. | Land | Improvement |
|---|---|---|---|---|
| 2025 | $3,247 | $107,600 | $0 | $0 |
| 2024 | $3,247 | $107,300 | $0 | $0 |
| 2023 | $3,985 | $100,500 | $0 | $0 |
| 2022 | $3,098 | $82,700 | $0 | $0 |
| 2021 | $3,413 | $74,200 | $0 | $0 |
| 2020 | $3,762 | $66,200 | $0 | $0 |
| 2019 | $337,566 | $63,600 | $0 | $0 |
| 2018 | $2,099 | $50,100 | $0 | $0 |
| 2017 | $1,155 | $48,000 | $0 | $0 |
| 2016 | $2,556 | $46,700 | $0 | $0 |
| 2015 | $4,714 | $49,600 | $0 | $0 |
| 2013 | $4,700 | $47,800 | $0 | $0 |
| 2012 | $2,087 | $48,100 | $18,000 | $30,100 |
Source: Public Records
Map
Nearby Homes
- 5954 Pine St
- 5908 Pine St
- 5671 Syracuse St
- 5689 Cornell St
- 24035 Currier St
- 6516 Oak St
- 23214 S Brookside Dr
- 6456 Birch St
- 6430 Banner St
- 6676 Syracuse St
- 4901 Cornell St
- 6420 Burr St
- 6733 Cornell St
- 24117 Eton Ave
- 24443 Powers Ave
- 4665 Syracuse St
- 24360 Pennie St
- 24339 Eton Ave
- 000 Hanover St
- 6832 Cornell St
- 5911 Syracuse St
- 5947 Syracuse St
- 5958 Madison St
- 5940 Madison St
- 6012 Madison St
- 6004 Syracuse St
- 5932 Syracuse St
- 5920 Syracuse St
- Syracuse St Unit VACANT 4050069
- Syracuse St Unit VACANT 4050071
- Syracuse St Unit 4913918
- Syracuse St Unit 4913915
- Syracuse St Unit 4909836
- Syracuse St Unit 4913907
- Syracuse St Unit 4913912
- Syracuse St Unit VACANT 4387271
- Syracuse St Unit VACANT 4387272
- Syracuse St Unit 1 4909247
- Syracuse St Unit 4906621
- Syracuse St Unit 4726307