Estimated Value: $366,000 - $387,728
3
Beds
2
Baths
1,079
Sq Ft
$349/Sq Ft
Est. Value
About This Home
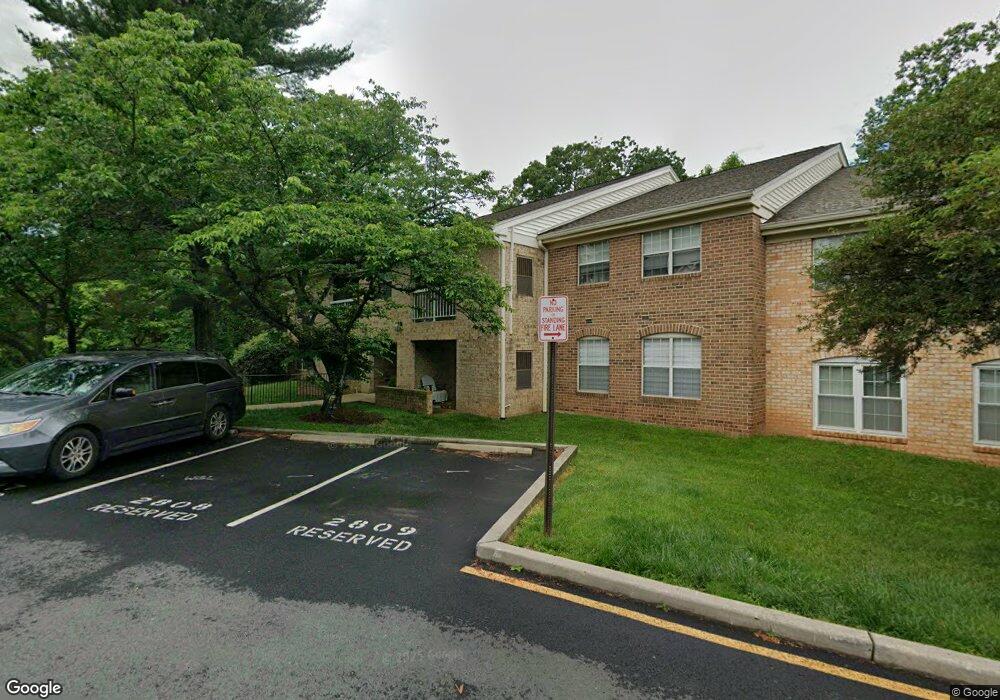
This home is located at 5928 Cove Landing Rd Unit 301, Burke, VA 22015 and is currently estimated at $376,864, approximately $349 per square foot. 5928 Cove Landing Rd Unit 301 is a home located in Fairfax County with nearby schools including Bonnie Brae Elementary School, James W Robinson, Jr. Secondary School, and Fairfax Baptist Temple Academy.
Ownership History
Date
Name
Owned For
Owner Type
Purchase Details
Closed on
Jul 25, 2011
Sold by
Chiprut Joshua and Chiprut Ilan
Bought by
Ruch Kathleen G
Current Estimated Value
Home Financials for this Owner
Home Financials are based on the most recent Mortgage that was taken out on this home.
Original Mortgage
$179,200
Outstanding Balance
$123,168
Interest Rate
4.49%
Mortgage Type
New Conventional
Estimated Equity
$253,696
Purchase Details
Closed on
Dec 17, 2003
Sold by
Chiprut Lynn J
Bought by
Chiprut Joshua and Chiprut,Llan
Home Financials for this Owner
Home Financials are based on the most recent Mortgage that was taken out on this home.
Original Mortgage
$117,600
Interest Rate
5.96%
Mortgage Type
New Conventional
Purchase Details
Closed on
Oct 28, 1999
Sold by
Walsh Robert E
Bought by
Chiprut Lynn J
Home Financials for this Owner
Home Financials are based on the most recent Mortgage that was taken out on this home.
Original Mortgage
$107,500
Interest Rate
7.78%
Create a Home Valuation Report for This Property
The Home Valuation Report is an in-depth analysis detailing your home's value as well as a comparison with similar homes in the area
Home Values in the Area
Average Home Value in this Area
Purchase History
| Date | Buyer | Sale Price | Title Company |
|---|---|---|---|
| Ruch Kathleen G | $224,000 | -- | |
| Chiprut Joshua | $147,000 | -- | |
| Chiprut Lynn J | $110,000 | -- |
Source: Public Records
Mortgage History
| Date | Status | Borrower | Loan Amount |
|---|---|---|---|
| Open | Ruch Kathleen G | $179,200 | |
| Previous Owner | Chiprut Joshua | $117,600 | |
| Previous Owner | Chiprut Lynn J | $107,500 |
Source: Public Records
Tax History Compared to Growth
Tax History
| Year | Tax Paid | Tax Assessment Tax Assessment Total Assessment is a certain percentage of the fair market value that is determined by local assessors to be the total taxable value of land and additions on the property. | Land | Improvement |
|---|---|---|---|---|
| 2025 | $3,913 | $364,770 | $73,000 | $291,770 |
| 2024 | $3,913 | $337,750 | $68,000 | $269,750 |
| 2023 | $3,700 | $327,910 | $66,000 | $261,910 |
| 2022 | $3,289 | $287,640 | $58,000 | $229,640 |
| 2021 | $3,375 | $287,640 | $58,000 | $229,640 |
| 2020 | $3,152 | $266,330 | $53,000 | $213,330 |
| 2019 | $3,055 | $258,150 | $52,000 | $206,150 |
| 2018 | $2,855 | $248,220 | $50,000 | $198,220 |
| 2017 | $2,771 | $238,670 | $48,000 | $190,670 |
| 2016 | $2,787 | $240,600 | $48,000 | $192,600 |
| 2015 | $2,685 | $240,600 | $48,000 | $192,600 |
| 2014 | $2,679 | $240,600 | $48,000 | $192,600 |
Source: Public Records
Map
Nearby Homes
- 5918 Cove Landing Rd Unit 204
- 5932 Cove Landing Rd Unit 101
- 5837 Cove Landing Rd Unit 101
- 5806 Cove Landing Rd Unit 304
- 5811 Cove Landing Rd Unit 301
- 6154 Martins Landing Ct
- 6115 Martins Landing Ct
- 10330 Luria Commons Ct Unit 1B
- 5976 Annaberg Place Unit 168
- 5816 Oak Leather Dr
- 12210 Wye Oak Commons Cir
- 6105 Heron Pond Ct
- 10205 Quiet Pond Terrace
- 10449 Calumet Grove Dr
- 10434 Calumet Grove Dr
- 6108 Pond Lily Ct
- 5879 Jacksons Oak Ct
- 10139 Wood Green Way
- 5703 Oak Stake Ct
- 5515 Cheshire Meadows Way
- 5928 Cove Landing Rd Unit 204
- 5928 Cove Landing Rd Unit 101A
- 5928 Cove Landing Rd Unit 203A
- 5928 Cove Landing Rd Unit 102A
- 5928 Cove Landing Rd Unit 201A
- 5926 Cove Landing Rd Unit 303B
- 5926 Cove Landing Rd Unit 301
- 5926 Cove Landing Rd Unit 201B
- 5926 Cove Landing Rd Unit 101B
- 5926 Cove Landing Rd Unit 204
- 5924 Cove Landing Rd Unit 203C
- 5924 Cove Landing Rd Unit 101C
- 5924 Cove Landing Rd Unit 102C
- 5924 Cove Landing Rd Unit 204C
- 5924 Cove Landing Rd Unit 302
- 5924 Cove Landing Rd Unit 304C
- 5924 Cove Landing Rd Unit 201
- 5930 Cove Landing Rd Unit 204
- 5930 Cove Landing Rd Unit 203
- 5930 Cove Landing Rd Unit 201