Estimated Value: $410,598 - $467,000
4
Beds
2
Baths
2,234
Sq Ft
$194/Sq Ft
Est. Value
About This Home
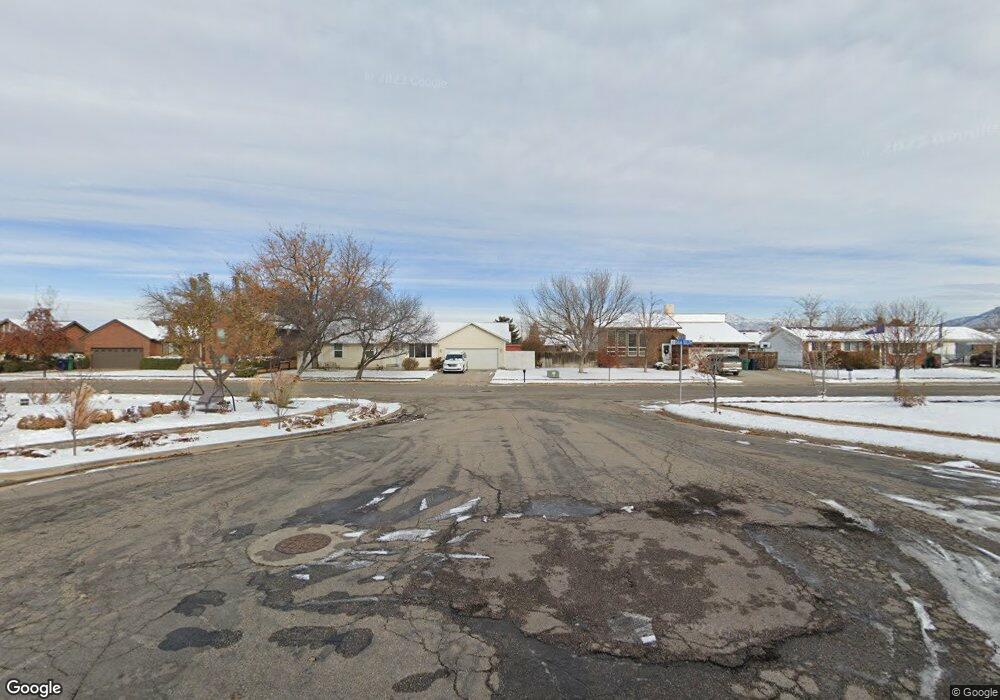
This home is located at 5928 S 3975 W, Roy, UT 84067 and is currently estimated at $434,400, approximately $194 per square foot. 5928 S 3975 W is a home located in Weber County with nearby schools including Freedom School, Roy Junior High School, and Roy High School.
Ownership History
Date
Name
Owned For
Owner Type
Purchase Details
Closed on
Feb 29, 2012
Sold by
Argyle Chad S and Argyle Dusty L
Bought by
Argyle Chad
Current Estimated Value
Purchase Details
Closed on
Jan 31, 2003
Sold by
Argyle Chad and Argyle Dusty L
Bought by
Argyle Chad
Purchase Details
Closed on
Feb 28, 2002
Sold by
Maestas Jennifer M and Murdock Jeanenne J
Bought by
Argyle Chad S and Argyle Dusty L
Home Financials for this Owner
Home Financials are based on the most recent Mortgage that was taken out on this home.
Original Mortgage
$122,970
Interest Rate
6.8%
Purchase Details
Closed on
Jan 9, 2002
Sold by
Sessions Jennifer M and Maestas Jennifer M
Bought by
Maestas Jennifer M
Home Financials for this Owner
Home Financials are based on the most recent Mortgage that was taken out on this home.
Original Mortgage
$122,970
Interest Rate
6.8%
Purchase Details
Closed on
Aug 13, 1998
Sold by
Schmitz Brad J and Schmitz Heather O
Bought by
Sessions Jennifer M and Murdock Jeanenne J
Home Financials for this Owner
Home Financials are based on the most recent Mortgage that was taken out on this home.
Original Mortgage
$60,000
Interest Rate
6.95%
Create a Home Valuation Report for This Property
The Home Valuation Report is an in-depth analysis detailing your home's value as well as a comparison with similar homes in the area
Home Values in the Area
Average Home Value in this Area
Purchase History
| Date | Buyer | Sale Price | Title Company |
|---|---|---|---|
| Argyle Chad | -- | Big Sky Title Insurance Agen | |
| Argyle Chad | -- | None Available | |
| Argyle Chad S | -- | Associated Title | |
| Maestas Jennifer M | -- | Associated Title | |
| Sessions Jennifer M | -- | Equity Title |
Source: Public Records
Mortgage History
| Date | Status | Borrower | Loan Amount |
|---|---|---|---|
| Open | Argyle Chad | $195,000 | |
| Closed | Argyle Chad | $40,000 | |
| Closed | Argyle Chad | $25,000 | |
| Closed | Argyle Chad S | $122,970 | |
| Previous Owner | Maestas Jennifer M | $30,000 | |
| Previous Owner | Sessions Jennifer M | $60,000 |
Source: Public Records
Tax History Compared to Growth
Tax History
| Year | Tax Paid | Tax Assessment Tax Assessment Total Assessment is a certain percentage of the fair market value that is determined by local assessors to be the total taxable value of land and additions on the property. | Land | Improvement |
|---|---|---|---|---|
| 2025 | $2,336 | $413,848 | $135,000 | $278,848 |
| 2024 | $2,258 | $221,649 | $74,257 | $147,392 |
| 2023 | $2,165 | $212,850 | $65,968 | $146,882 |
| 2022 | $2,400 | $240,350 | $60,501 | $179,849 |
| 2021 | $1,805 | $300,000 | $80,017 | $219,983 |
| 2020 | $1,629 | $248,000 | $80,017 | $167,983 |
| 2019 | $1,690 | $243,000 | $45,048 | $197,952 |
| 2018 | $1,567 | $213,000 | $39,924 | $173,076 |
| 2017 | $1,460 | $187,000 | $39,924 | $147,076 |
| 2016 | $1,341 | $92,649 | $21,415 | $71,234 |
| 2015 | $1,154 | $82,249 | $21,415 | $60,834 |
| 2014 | $1,127 | $79,398 | $18,611 | $60,787 |
Source: Public Records
Map
Nearby Homes