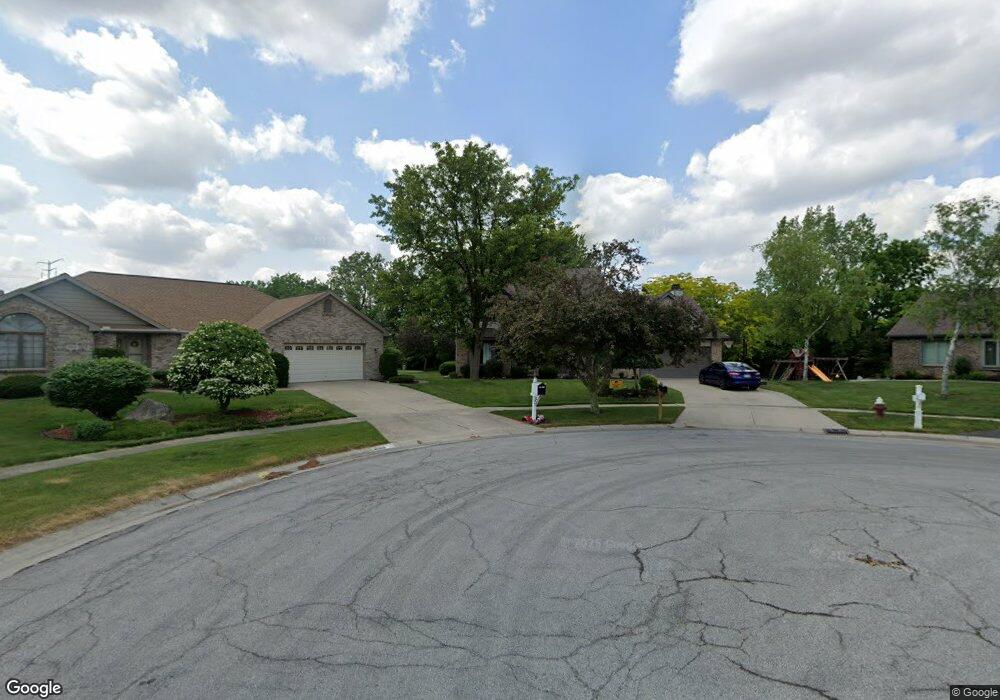
5929 Martha Ct Sylvania, OH 43560
Estimated Value: $397,000 - $402,000
4
Beds
3
Baths
2,516
Sq Ft
$159/Sq Ft
Est. Value
About This Home
This home is located at 5929 Martha Ct, Sylvania, OH 43560 and is currently estimated at $398,884, approximately $158 per square foot. 5929 Martha Ct is a home located in Lucas County with nearby schools including Highland Elementary School, Sylvania McCord Junior High School, and Sylvania Northview High School.
Ownership History
Date
Name
Owned For
Owner Type
Purchase Details
Closed on
Jul 30, 2010
Sold by
Severson Randall W and Severson Amy R
Bought by
Moore Jerome R and Moore Angela M
Current Estimated Value
Home Financials for this Owner
Home Financials are based on the most recent Mortgage that was taken out on this home.
Original Mortgage
$207,209
Outstanding Balance
$137,538
Interest Rate
4.62%
Mortgage Type
FHA
Estimated Equity
$261,346
Purchase Details
Closed on
Jan 30, 1998
Sold by
Appleton Thomas M and Appleton Janet R
Bought by
Severson Randall W and Severson Amy R
Home Financials for this Owner
Home Financials are based on the most recent Mortgage that was taken out on this home.
Original Mortgage
$123,000
Interest Rate
7.08%
Purchase Details
Closed on
Jun 15, 1990
Create a Home Valuation Report for This Property
The Home Valuation Report is an in-depth analysis detailing your home's value as well as a comparison with similar homes in the area
Home Values in the Area
Average Home Value in this Area
Purchase History
| Date | Buyer | Sale Price | Title Company |
|---|---|---|---|
| Moore Jerome R | $209,900 | Attorney | |
| Severson Randall W | $188,000 | Louisville Title Agency For | |
| -- | $33,500 | -- |
Source: Public Records
Mortgage History
| Date | Status | Borrower | Loan Amount |
|---|---|---|---|
| Open | Moore Jerome R | $207,209 | |
| Previous Owner | Severson Randall W | $123,000 |
Source: Public Records
Tax History Compared to Growth
Tax History
| Year | Tax Paid | Tax Assessment Tax Assessment Total Assessment is a certain percentage of the fair market value that is determined by local assessors to be the total taxable value of land and additions on the property. | Land | Improvement |
|---|---|---|---|---|
| 2024 | $4,153 | $132,650 | $22,190 | $110,460 |
| 2023 | $6,620 | $91,910 | $20,195 | $71,715 |
| 2022 | $6,630 | $91,910 | $20,195 | $71,715 |
| 2021 | $6,847 | $91,910 | $20,195 | $71,715 |
| 2020 | $7,369 | $88,060 | $16,275 | $71,785 |
| 2019 | $7,082 | $88,060 | $16,275 | $71,785 |
| 2018 | $6,419 | $88,060 | $16,275 | $71,785 |
| 2017 | $6,272 | $71,225 | $13,720 | $57,505 |
| 2016 | $6,147 | $203,500 | $39,200 | $164,300 |
| 2015 | $5,778 | $203,500 | $39,200 | $164,300 |
| 2014 | $5,415 | $68,500 | $13,200 | $55,300 |
| 2013 | $5,415 | $68,500 | $13,200 | $55,300 |
Source: Public Records
Map
Nearby Homes
- 6025 Hawthorne Dr
- 8367 Fossil Ave
- 8334 Ledgestone Ave Unit 8334
- 8362 Sylvania Metamora Rd
- 5646 Breezy Porch Dr
- 7858 Erie St
- 5666 Fox Hollow Ct
- 6129 Burrwood Dr
- 6047 Peppermill Dr
- 5434 Willow Cir
- 8134 Little Rd
- 5346 Palisades Dr
- 8753 N Stone Mill Rd
- 5235 Brookfield Ln
- 5914 Winding Way Dr
- 6200 Yankee Rd
- 9011 Bear Creek Dr
- 5310 Turnberry Ln
- 5360 Brint Crossing Blvd
- 8917 Creekdale Rd
- 5923 Martha Ct
- 5930 Martha Ct
- 5932 Brown Ln
- 6001 Deepwood Dr
- 6000 Deepwood Ct
- 8214 Doyle Dr
- 5924 Brown Ln
- 5917 Martha Ct
- 5924 Martha Ct
- 5916 Brown Ln
- 5909 Martha Ct
- 6005 Deepwood Dr
- 5918 Martha Ct
- 6004 Deepwood Ct
- 6006 Frances Ct
- 6012 Frances Ct
- 5908 Brown Ln
- 5910 Martha Ct
- 5901 Martha Ct
- 5935 Apple Meadow Dr