Estimated Value: $543,000 - $632,000
6
Beds
3
Baths
3,260
Sq Ft
$182/Sq Ft
Est. Value
About This Home
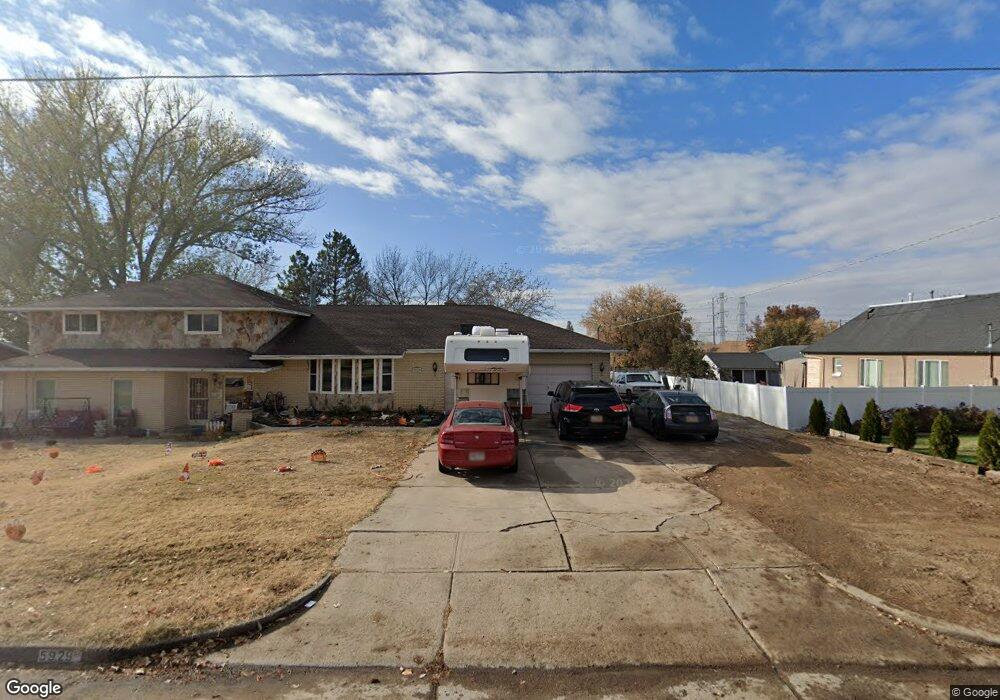
This home is located at 5929 S 3100 W, Roy, UT 84067 and is currently estimated at $591,902, approximately $181 per square foot. 5929 S 3100 W is a home located in Weber County with nearby schools including Roy Elementary School, Roy Junior High School, and Roy High School.
Ownership History
Date
Name
Owned For
Owner Type
Purchase Details
Closed on
Jul 31, 2008
Sold by
Berry Robert L and Berry Elise S
Bought by
Hughes Robert W and Hughes Tonya A
Current Estimated Value
Home Financials for this Owner
Home Financials are based on the most recent Mortgage that was taken out on this home.
Original Mortgage
$265,590
Outstanding Balance
$174,997
Interest Rate
6.41%
Mortgage Type
VA
Estimated Equity
$416,905
Purchase Details
Closed on
Dec 23, 2003
Sold by
Bertagnolli Jim M and Bertagnolli Shelly R
Bought by
Berry Robert L and Berry Elise S
Purchase Details
Closed on
Sep 24, 1998
Sold by
Heiner Alonzo C and Heiner Susan Ann
Bought by
Bertagnolli Jim M and Bertagnolli Shelly R
Home Financials for this Owner
Home Financials are based on the most recent Mortgage that was taken out on this home.
Original Mortgage
$114,000
Interest Rate
6.88%
Create a Home Valuation Report for This Property
The Home Valuation Report is an in-depth analysis detailing your home's value as well as a comparison with similar homes in the area
Home Values in the Area
Average Home Value in this Area
Purchase History
| Date | Buyer | Sale Price | Title Company |
|---|---|---|---|
| Hughes Robert W | -- | Bonneville Superior Title Co | |
| Berry Robert L | -- | -- | |
| Bertagnolli Jim M | -- | Associated Title Company |
Source: Public Records
Mortgage History
| Date | Status | Borrower | Loan Amount |
|---|---|---|---|
| Open | Hughes Robert W | $265,590 | |
| Previous Owner | Bertagnolli Jim M | $114,000 |
Source: Public Records
Tax History
| Year | Tax Paid | Tax Assessment Tax Assessment Total Assessment is a certain percentage of the fair market value that is determined by local assessors to be the total taxable value of land and additions on the property. | Land | Improvement |
|---|---|---|---|---|
| 2025 | $343 | $604,170 | $152,894 | $451,276 |
| 2024 | $337 | $326,149 | $84,002 | $242,147 |
| 2023 | $325 | $326,700 | $84,002 | $242,698 |
| 2022 | $1,046 | $356,950 | $70,663 | $286,287 |
| 2021 | $2,977 | $445,000 | $98,669 | $346,331 |
| 2020 | $2,739 | $375,000 | $98,669 | $276,331 |
| 2019 | $2,695 | $349,000 | $61,257 | $287,743 |
| 2018 | $2,544 | $311,000 | $57,990 | $253,010 |
| 2017 | $2,425 | $279,000 | $56,321 | $222,679 |
| 2016 | $2,458 | $153,336 | $27,788 | $125,548 |
| 2015 | $2,383 | $153,336 | $24,917 | $128,419 |
| 2014 | $2,402 | $153,336 | $24,917 | $128,419 |
Source: Public Records
Map
Nearby Homes
Your Personal Tour Guide
Ask me questions while you tour the home.