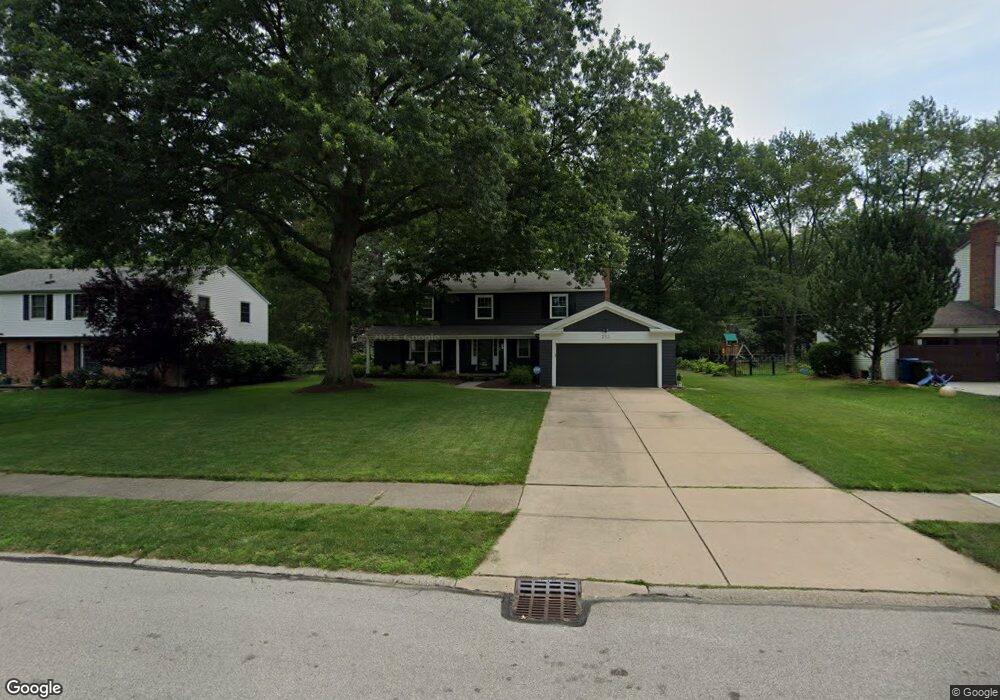
593 Dwight Dr Bay Village, OH 44140
Estimated Value: $569,000 - $636,000
4
Beds
3
Baths
2,496
Sq Ft
$245/Sq Ft
Est. Value
About This Home
This home is located at 593 Dwight Dr, Bay Village, OH 44140 and is currently estimated at $611,821, approximately $245 per square foot. 593 Dwight Dr is a home located in Cuyahoga County with nearby schools including Westerly Elementary School, Normandy Elementary School, and Bay Middle School.
Ownership History
Date
Name
Owned For
Owner Type
Purchase Details
Closed on
Aug 15, 1995
Sold by
Humpage Thomas L
Bought by
Jelepis Thomas L and Jelepis Beverly L
Current Estimated Value
Home Financials for this Owner
Home Financials are based on the most recent Mortgage that was taken out on this home.
Original Mortgage
$169,000
Interest Rate
7.51%
Mortgage Type
New Conventional
Purchase Details
Closed on
Jun 25, 1985
Sold by
Mccormick Richard E
Bought by
Humpage Thomas E and Humpage Anita M
Purchase Details
Closed on
Mar 4, 1983
Sold by
Stritch Clifford F
Bought by
Mccormick Richard E
Purchase Details
Closed on
Jan 15, 1981
Sold by
Eastland Nicholas L
Bought by
Stritch Clifford F
Purchase Details
Closed on
Dec 13, 1978
Sold by
Newkirk Karl E and Newkirk Charlotte M
Bought by
Eastland Nicholas L
Purchase Details
Closed on
Jan 1, 1975
Bought by
Newkirk Karl E and Newkirk Charlotte M
Create a Home Valuation Report for This Property
The Home Valuation Report is an in-depth analysis detailing your home's value as well as a comparison with similar homes in the area
Home Values in the Area
Average Home Value in this Area
Purchase History
| Date | Buyer | Sale Price | Title Company |
|---|---|---|---|
| Jelepis Thomas L | $207,000 | -- | |
| Humpage Thomas E | $136,500 | -- | |
| Mccormick Richard E | $127,500 | -- | |
| Stritch Clifford F | $121,000 | -- | |
| Eastland Nicholas L | $106,200 | -- | |
| Newkirk Karl E | -- | -- |
Source: Public Records
Mortgage History
| Date | Status | Borrower | Loan Amount |
|---|---|---|---|
| Closed | Jelepis Thomas L | $169,000 |
Source: Public Records
Tax History Compared to Growth
Tax History
| Year | Tax Paid | Tax Assessment Tax Assessment Total Assessment is a certain percentage of the fair market value that is determined by local assessors to be the total taxable value of land and additions on the property. | Land | Improvement |
|---|---|---|---|---|
| 2024 | $13,639 | $201,250 | $28,805 | $172,445 |
| 2023 | $9,945 | $124,320 | $26,040 | $98,280 |
| 2022 | $9,899 | $124,320 | $26,040 | $98,280 |
| 2021 | $8,970 | $124,320 | $26,040 | $98,280 |
| 2020 | $9,068 | $113,020 | $23,660 | $89,360 |
| 2019 | $8,804 | $322,900 | $67,600 | $255,300 |
| 2018 | $8,795 | $113,020 | $23,660 | $89,360 |
| 2017 | $8,329 | $97,340 | $18,830 | $78,510 |
| 2016 | $8,295 | $97,340 | $18,830 | $78,510 |
| 2015 | $7,379 | $97,340 | $18,830 | $78,510 |
| 2014 | $7,379 | $89,180 | $17,430 | $71,750 |
Source: Public Records
Map
Nearby Homes
- 624 Millard Dr
- 589 Debbington Dr
- 29305 Osborn Rd
- 28205 W Oviatt Rd
- 27870 Birchwood Ct
- 798 N Greenway Dr
- 841 S Parkside Dr
- 879 S Parkside Dr
- 27841 Birchwood Ct
- 29806 Osborn Rd
- 625 Bassett Rd
- 584 Wildbrook Dr
- 433 Bassett Rd
- 477 Cahoon Rd
- 479 Cahoon Rd
- 481 Cahoon Rd
- 382 Bassett Rd
- 495 Cahoon Rd
- 27407 Wolf Rd
- 30200 Westlawn Dr
- 601 Dwight Dr
- 589 Dwight Dr
- 607 Dwight Dr
- 581 Dwight Dr
- 594 Revere Dr
- 590 Revere Dr
- 598 Revere Dr
- 604 Dwight Dr
- 584 Dwight Dr
- 586 Revere Dr
- 604 Revere Dr
- 575 Dwight Dr
- 613 Dwight Dr
- 28915 Buchanan Dr
- 28914 Buchanan Dr
- 28743 Lincoln Rd
- 608 Revere Dr
- 28739 Lincoln Rd
- 28929 Buchanan Dr
- 28928 Buchanan Dr