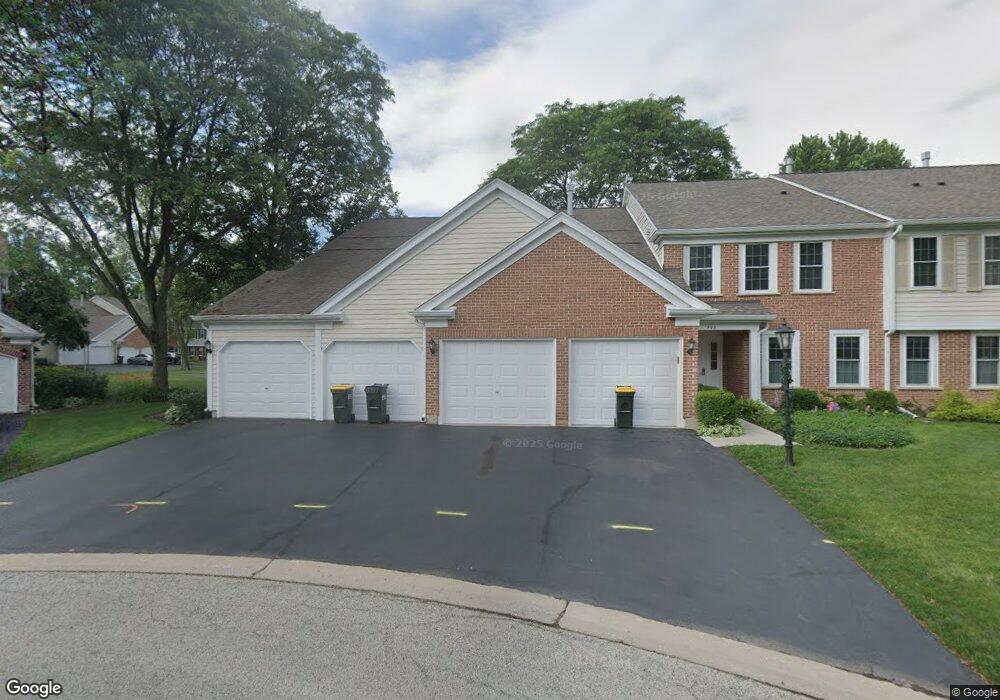
593 Edinburgh Ln Unit 132111 Prospect Heights, IL 60070
Estimated Value: $329,474 - $375,000
2
Beds
--
Bath
1,246
Sq Ft
$281/Sq Ft
Est. Value
About This Home
This home is located at 593 Edinburgh Ln Unit 132111, Prospect Heights, IL 60070 and is currently estimated at $350,369, approximately $281 per square foot. 593 Edinburgh Ln Unit 132111 is a home located in Cook County with nearby schools including Euclid Elementary School, River Trails Middle School, and John Hersey High School.
Ownership History
Date
Name
Owned For
Owner Type
Purchase Details
Closed on
Mar 31, 2021
Sold by
Mazur Stephen and Mazur Danuta
Bought by
Mazur Stephen and The Mazur Family Trust
Current Estimated Value
Purchase Details
Closed on
Oct 9, 2015
Sold by
Newman Khei Eun
Bought by
Mazur Stephen and Mazur Danuta
Purchase Details
Closed on
May 24, 2004
Sold by
Newman Khei Eun
Bought by
Newman Khei Eun and Khei Eun Newman Trust
Purchase Details
Closed on
May 11, 1999
Sold by
Cody Evelyn
Bought by
Newman Khei Eun
Home Financials for this Owner
Home Financials are based on the most recent Mortgage that was taken out on this home.
Original Mortgage
$122,800
Interest Rate
6.92%
Purchase Details
Closed on
Jun 12, 1995
Sold by
Cody Evelyn and Hepner Evelyn
Bought by
Cody Evelyn
Create a Home Valuation Report for This Property
The Home Valuation Report is an in-depth analysis detailing your home's value as well as a comparison with similar homes in the area
Home Values in the Area
Average Home Value in this Area
Purchase History
| Date | Buyer | Sale Price | Title Company |
|---|---|---|---|
| Mazur Stephen | -- | Attorney | |
| Mazur Stephen | $182,000 | Fidelity National Title | |
| Newman Khei Eun | -- | -- | |
| Newman Khei Eun | $153,500 | -- | |
| Cody Evelyn | -- | -- |
Source: Public Records
Mortgage History
| Date | Status | Borrower | Loan Amount |
|---|---|---|---|
| Previous Owner | Newman Khei Eun | $122,800 |
Source: Public Records
Tax History Compared to Growth
Tax History
| Year | Tax Paid | Tax Assessment Tax Assessment Total Assessment is a certain percentage of the fair market value that is determined by local assessors to be the total taxable value of land and additions on the property. | Land | Improvement |
|---|---|---|---|---|
| 2024 | $4,449 | $19,910 | $1,793 | $18,117 |
| 2023 | $4,118 | $19,910 | $1,793 | $18,117 |
| 2022 | $4,118 | $19,910 | $1,793 | $18,117 |
| 2021 | $2,904 | $16,476 | $560 | $15,916 |
| 2020 | $2,598 | $16,476 | $560 | $15,916 |
| 2019 | $2,576 | $18,457 | $560 | $17,897 |
| 2018 | $2,812 | $15,433 | $448 | $14,985 |
| 2017 | $2,041 | $15,433 | $448 | $14,985 |
| 2016 | $3,370 | $15,433 | $448 | $14,985 |
| 2015 | $2,943 | $13,454 | $896 | $12,558 |
| 2014 | $2,702 | $13,454 | $896 | $12,558 |
| 2013 | $2,599 | $13,454 | $896 | $12,558 |
Source: Public Records
Map
Nearby Homes
- 501 Aberdeen Ln Unit C
- 688 Glasgow Ln Unit 121133
- 603 Thistle Ln Unit 16185
- 212 Country Club Dr Unit 198
- 763 Sussex Corner Ln Unit 15
- 354 Country Club Dr
- 302 Lonsdale Rd
- 1214 N Crabtree Ln
- 1121 N Greenfield Ln
- 206 E Camp Mcdonald Rd
- 1116 N Westgate Rd
- 203 Coldren Dr
- 703 Newcastle Ln
- 1142 N Boxwood Dr Unit B
- 1120 N Boxwood Dr Unit B
- 300 E Marion Ave
- 1000 N Westgate Rd
- 1008 N Newberry Ln
- 1400 N Elmhurst Rd Unit 106
- 1400 N Elmhurst Rd Unit 302
- 593 Edinburgh Ln Unit 132111
- 593 Edinburgh Ln Unit 132111
- 593 Edinburgh Ln Unit B
- 585 Edinburgh Ln Unit 132111
- 585 Edinburgh Ln Unit 132111
- 585 Edinburgh Ln Unit 132111
- 585 Edinburgh Ln Unit 132111
- 585 Edinburgh Ln Unit D
- 585 Edinburgh Ln Unit C
- 585 Edinburgh Ln Unit B
- 601 Edinburgh Ln Unit D
- 601 Edinburgh Ln Unit 132110
- 601 Edinburgh Ln Unit 132110
- 601 Edinburgh Ln Unit 132110
- 601 Edinburgh Ln Unit 132110
- 601 Edinburgh Ln Unit C
- 225 Rob Roy Ln Unit C
- 225 Rob Roy Ln Unit 12766
- 225 Rob Roy Ln Unit 12766