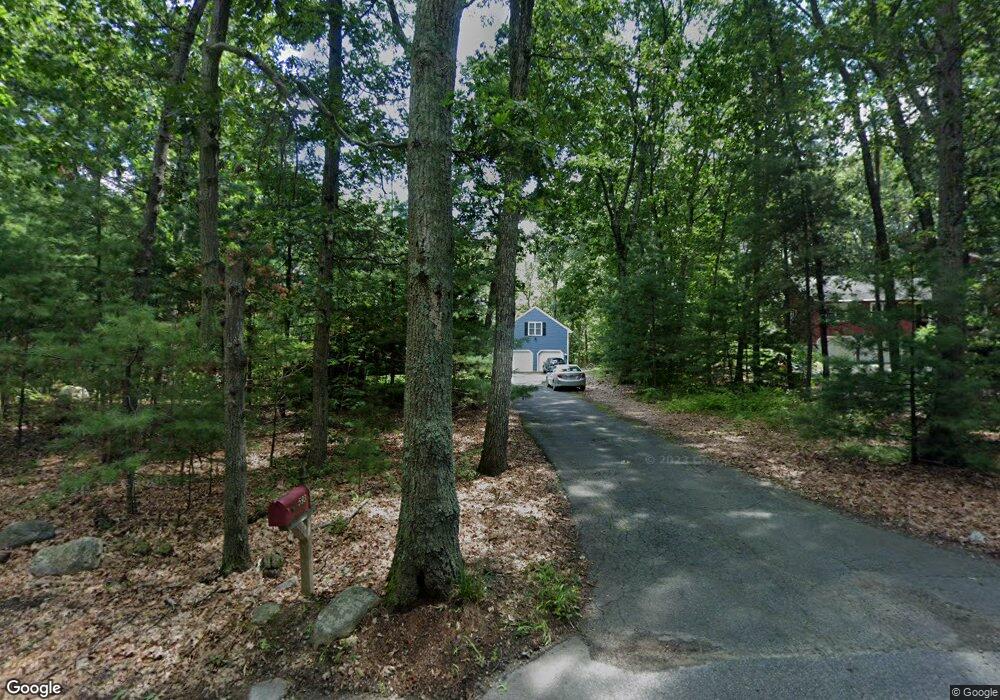
593 Hemenway St Marlborough, MA 01752
Estimated Value: $711,202 - $817,000
3
Beds
2
Baths
2,072
Sq Ft
$376/Sq Ft
Est. Value
About This Home
This home is located at 593 Hemenway St, Marlborough, MA 01752 and is currently estimated at $778,051, approximately $375 per square foot. 593 Hemenway St is a home located in Middlesex County with nearby schools including Marlborough High School, New Covenant Christian School, and Glenhaven Academy - JRI School.
Ownership History
Date
Name
Owned For
Owner Type
Purchase Details
Closed on
Dec 19, 2000
Sold by
Mossman John J
Bought by
Pelliccio John R and Pelliccio Laura B
Current Estimated Value
Home Financials for this Owner
Home Financials are based on the most recent Mortgage that was taken out on this home.
Original Mortgage
$261,000
Interest Rate
7.7%
Mortgage Type
Purchase Money Mortgage
Create a Home Valuation Report for This Property
The Home Valuation Report is an in-depth analysis detailing your home's value as well as a comparison with similar homes in the area
Home Values in the Area
Average Home Value in this Area
Purchase History
| Date | Buyer | Sale Price | Title Company |
|---|---|---|---|
| Pelliccio John R | $290,000 | -- |
Source: Public Records
Mortgage History
| Date | Status | Borrower | Loan Amount |
|---|---|---|---|
| Open | Pelliccio John R | $286,000 | |
| Closed | Pelliccio John R | $254,800 | |
| Closed | Pelliccio John R | $261,000 |
Source: Public Records
Tax History Compared to Growth
Tax History
| Year | Tax Paid | Tax Assessment Tax Assessment Total Assessment is a certain percentage of the fair market value that is determined by local assessors to be the total taxable value of land and additions on the property. | Land | Improvement |
|---|---|---|---|---|
| 2025 | $6,472 | $656,400 | $238,500 | $417,900 |
| 2024 | $6,256 | $610,900 | $216,700 | $394,200 |
| 2023 | $6,656 | $576,800 | $187,500 | $389,300 |
| 2022 | $6,464 | $492,700 | $178,800 | $313,900 |
| 2021 | $93 | $461,600 | $149,200 | $312,400 |
| 2020 | $0 | $441,000 | $142,200 | $298,800 |
| 2019 | $6,040 | $429,300 | $139,600 | $289,700 |
| 2018 | $6,036 | $412,600 | $128,700 | $283,900 |
| 2017 | $5,935 | $387,400 | $130,900 | $256,500 |
| 2016 | $5,751 | $374,900 | $130,900 | $244,000 |
| 2015 | $5,844 | $370,800 | $134,400 | $236,400 |
Source: Public Records
Map
Nearby Homes
- 168 Blanchette Dr
- 618 Sudbury St
- 551 Sudbury St
- 17 Mcneil Cir
- 28 Stetson Dr
- 3 Stonehill Rd
- 38 Collins Dr
- 16 Minehan Ln
- 114 Linda Cir
- 492 Stow Rd
- 688 Boston Post Rd E Unit 202
- 688 Boston Post Rd E Unit 304
- 688 Boston Post Rd E Unit 100
- 688 Boston Post Rd E Unit 324
- 688 Boston Post Rd E Unit 228
- 274 Naugler Ave
- 624 Boston Post Rd E Unit 7
- 608 Boston Post Rd E Unit 11
- 596 Boston Post Rd E Unit 13
- 596 Boston Post Rd E