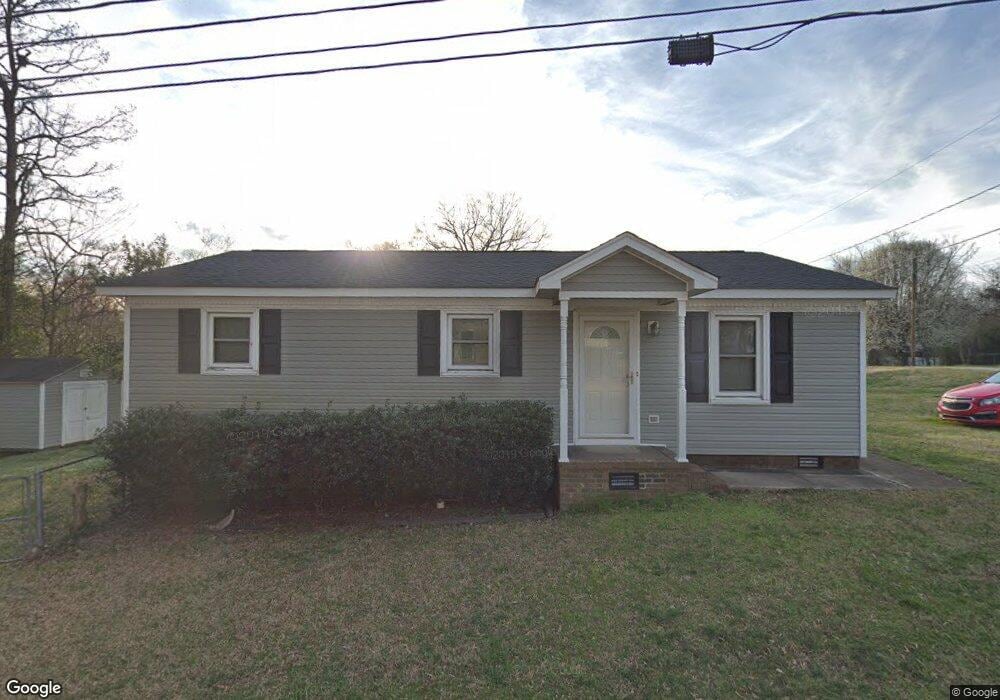
593 Splicewood Dr SW Concord, NC 28027
Estimated Value: $193,000 - $266,000
3
Beds
1
Bath
1,066
Sq Ft
$213/Sq Ft
Est. Value
About This Home
This home is located at 593 Splicewood Dr SW, Concord, NC 28027 and is currently estimated at $226,844, approximately $212 per square foot. 593 Splicewood Dr SW is a home located in Cabarrus County with nearby schools including Wolf Meadow Elementary School, J.N. Fries Middle School, and Branch Christian Academy.
Ownership History
Date
Name
Owned For
Owner Type
Purchase Details
Closed on
Apr 3, 2009
Sold by
Purser Nancy and Purser Terry
Bought by
Troutman Kevin M
Current Estimated Value
Purchase Details
Closed on
Oct 1, 2008
Sold by
Wells Fargo Bank Na
Bought by
Purser Nancy
Purchase Details
Closed on
Mar 24, 2008
Sold by
Schaefer Paul Gene and Schaefer Oma Annette
Bought by
Wells Fargo Bank Na
Purchase Details
Closed on
Jan 13, 2006
Sold by
Lambert William Robert
Bought by
Schaefer Paul Gene and Schaefer Oma Annette
Home Financials for this Owner
Home Financials are based on the most recent Mortgage that was taken out on this home.
Original Mortgage
$80,910
Interest Rate
9.3%
Mortgage Type
Fannie Mae Freddie Mac
Purchase Details
Closed on
Jan 1, 1984
Bought by
Lambert William Robert
Create a Home Valuation Report for This Property
The Home Valuation Report is an in-depth analysis detailing your home's value as well as a comparison with similar homes in the area
Home Values in the Area
Average Home Value in this Area
Purchase History
| Date | Buyer | Sale Price | Title Company |
|---|---|---|---|
| Troutman Kevin M | $60,000 | None Available | |
| Purser Nancy | $37,500 | None Available | |
| Wells Fargo Bank Na | $92,901 | None Available | |
| Schaefer Paul Gene | $90,000 | Multiple | |
| Lambert William Robert | $36,500 | -- |
Source: Public Records
Mortgage History
| Date | Status | Borrower | Loan Amount |
|---|---|---|---|
| Previous Owner | Schaefer Paul Gene | $80,910 |
Source: Public Records
Tax History Compared to Growth
Tax History
| Year | Tax Paid | Tax Assessment Tax Assessment Total Assessment is a certain percentage of the fair market value that is determined by local assessors to be the total taxable value of land and additions on the property. | Land | Improvement |
|---|---|---|---|---|
| 2025 | $1,924 | $193,140 | $40,000 | $153,140 |
| 2024 | $1,924 | $193,140 | $40,000 | $153,140 |
| 2023 | $1,332 | $109,140 | $17,600 | $91,540 |
| 2022 | $1,332 | $109,140 | $17,600 | $91,540 |
| 2021 | $1,332 | $109,140 | $17,600 | $91,540 |
| 2020 | $1,332 | $109,140 | $17,600 | $91,540 |
| 2019 | $1,033 | $84,700 | $11,200 | $73,500 |
| 2018 | $1,016 | $84,700 | $11,200 | $73,500 |
| 2017 | $999 | $84,700 | $11,200 | $73,500 |
| 2016 | $593 | $78,490 | $12,000 | $66,490 |
| 2015 | $926 | $78,490 | $12,000 | $66,490 |
| 2014 | $926 | $78,490 | $12,000 | $66,490 |
Source: Public Records
Map
Nearby Homes
- 933 Old Charlotte Rd
- 82 Highland Ave SW
- 84 Highland Ave SW
- 809 Fargo Dr SW
- 1067 Old Charlotte Rd
- 207 Highland Ave SW
- Lot #2 Faith Dr SW
- 782 Chalice St SW
- 664 Jackson Terrace SW
- 220 Highland Ave SW
- 758 Main St SW
- 668 Jackson Terrace SW
- 609 Faith Dr SW Unit 1
- 41 Fleetwood Dr SW
- 64 Robinson Dr SW
- 2893 Signal Ct SW
- 1015 Rockland Cir SW
- 1255 Old Charlotte Rd
- 2824 Trestle Ct SW
- 368 Office Dr SW
- 599 Splicewood Dr SW
- 577 Splicewood Dr SW
- 594 Splicewood Dr SW
- 414 Faith Dr SW
- 951 Old Charlotte Rd
- 945 Old Charlotte Rd
- 427 Faith Dr SW
- 397 Faith Dr SW
- 422 Faith Dr SW
- 959 Old Charlotte Rd
- 433 Faith Dr SW
- 553 Splicewood Dr SW
- 566 Splicewood Dr SW
- 935 Old Charlotte Rd SW
- 395 Faith Dr SW
- 935 Old Charlotte Rd
- 392 Faith Dr SW
- 555 Splicewood Dr SW
- 439 Faith Dr SW
- 428 Faith Dr SW