5930 S Union Ave Chicago, IL 60621
Englewood NeighborhoodEstimated Value: $216,000
Studio
2
Baths
--
Sq Ft
0.72
Acres Lot
About This Home
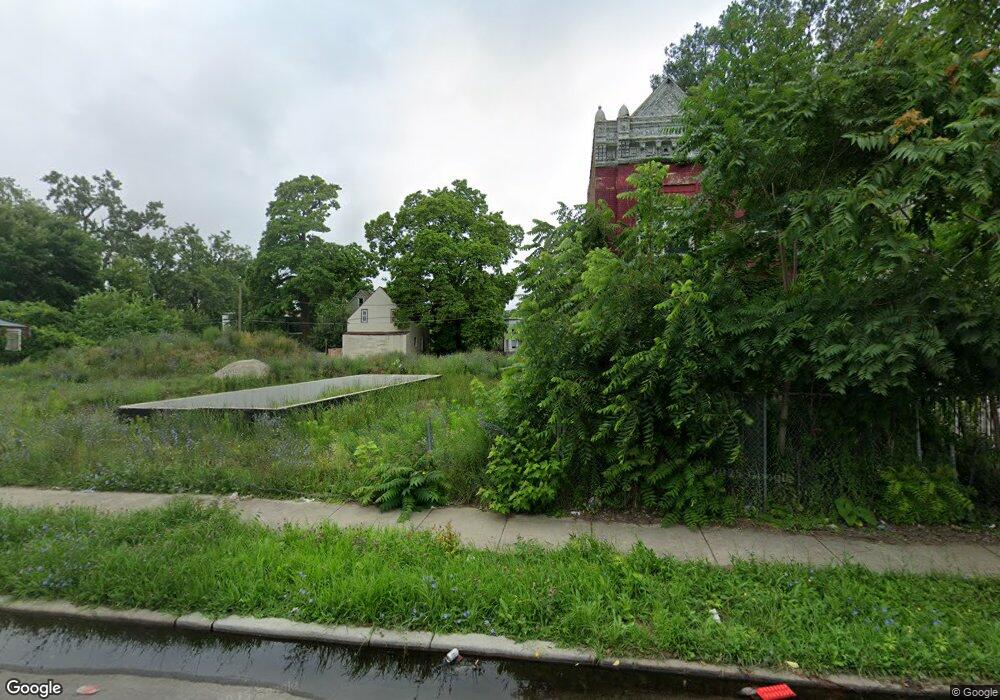
This home is located at 5930 S Union Ave, Chicago, IL 60621 and is currently estimated at $216,000. 5930 S Union Ave is a home located in Cook County with nearby schools including Nicholson Technology Acad Elementary School, KIPP Bloom Charter Elementary School, and Urban Prep Charter Academy for Young Men - Englewood.
Ownership History
Date
Name
Owned For
Owner Type
Purchase Details
Closed on
Mar 16, 2018
Sold by
City Of Chicago
Bought by
Dorsey Letita
Current Estimated Value
Purchase Details
Closed on
Jan 20, 2015
Sold by
Young
Bought by
City Of Chicago
Purchase Details
Closed on
Aug 6, 2002
Sold by
Pioneer Services Llc
Bought by
Young Tonnie L
Home Financials for this Owner
Home Financials are based on the most recent Mortgage that was taken out on this home.
Original Mortgage
$54,400
Interest Rate
10.4%
Mortgage Type
Purchase Money Mortgage
Purchase Details
Closed on
Oct 19, 2001
Sold by
Pioneer Funding Inc
Bought by
Pioneer Services Llc
Purchase Details
Closed on
May 4, 2001
Sold by
Orr David D
Bought by
Pioneer Funding Inc
Purchase Details
Closed on
Sep 30, 2000
Sold by
Traylor Valerie L and Williams Flussie
Bought by
Traylor Edgar P
Purchase Details
Closed on
May 26, 1994
Sold by
Traylor Edgar and Williams Flossie
Bought by
Traylor Valerie L and Williams Flossie
Create a Home Valuation Report for This Property
The Home Valuation Report is an in-depth analysis detailing your home's value as well as a comparison with similar homes in the area
Home Values in the Area
Average Home Value in this Area
Purchase History
We collect this data history from publicly available records. To have your information removed, we recommend requesting removal directly through your county’s website.
| Date | Buyer | Sale Price | Title Company |
|---|---|---|---|
| Dorsey Letita | -- | None Available | |
| City Of Chicago | -- | None Available | |
| Young Tonnie L | $68,000 | Exeter Title Company | |
| Pioneer Services Llc | -- | -- | |
| Pioneer Funding Inc | -- | -- | |
| Traylor Edgar P | -- | -- | |
| Traylor Valerie L | -- | -- |
Source: Public Records
Mortgage History
We collect this data history from publicly available records. To have your information removed, we recommend requesting removal directly through your county’s website.
| Date | Status | Borrower | Loan Amount |
|---|---|---|---|
| Previous Owner | Young Tonnie L | $54,400 | |
| Closed | Young Tonnie L | $6,800 |
Source: Public Records
Tax History
| Year | Tax Paid | Tax Assessment Tax Assessment Total Assessment is a certain percentage of the fair market value that is determined by local assessors to be the total taxable value of land and additions on the property. | Land | Improvement |
|---|---|---|---|---|
| 2025 | $293 | $833 | $833 | -- |
| 2024 | $293 | $833 | $833 | -- |
| 2023 | $285 | $1,388 | $1,388 | -- |
| 2022 | $285 | $1,388 | $1,388 | $0 |
| 2021 | $279 | $1,388 | $1,388 | $0 |
| 2020 | $464 | $2,082 | $2,082 | $0 |
| 2019 | $418 | $2,082 | $2,082 | $0 |
| 2018 | $0 | $0 | $0 | $0 |
| 2017 | $0 | $0 | $0 | $0 |
| 2016 | $0 | $0 | $0 | $0 |
| 2015 | $372 | $2,031 | $2,031 | $0 |
| 2014 | $348 | $1,875 | $1,875 | $0 |
| 2013 | $341 | $1,875 | $1,875 | $0 |
Source: Public Records
Map
Nearby Homes
- 5922 S Emerald Ave
- 352 W 59th St
- 5917 S Green St
- 542 W 60th St
- 534 W 60th St
- 540 W 60th St
- 5932 S Parnell Ave
- 6036 S Wallace St
- 6025 S Green St
- 524 W 60th St
- 519 W 60th Place
- 439 W 60th Place
- 451 W 60th Place
- 518 W 60th Place
- 523 W 60th Place
- 5843 S Peoria St
- 5918 S Peoria St
- 538 W 61st St
- 6045 S Peoria St
- 5744 S Green St
- 5928 S Union Ave Unit 1
- 5928 S Union Ave
- 5926 S Union Ave
- 5914 S Union Ave
- 5944 S Union Ave
- 5929 S Union Ave Unit 1
- 5929 S Union Ave
- 5933 S Union Ave
- 5925 S Emerald Ave
- 5925 S Emerald Ave
- 5937 S Emerald Ave
- 5927 S Union Ave
- 5927 S Union Ave
- 5946 S Union Ave
- 5927 S Emerald Ave
- 5927 S Emerald Ave
- 5921 S Emerald Ave
- 5937 S Union Ave
- 5937 S Union Ave
- 5923 S Emerald Ave
Your Personal Tour Guide
Ask me questions while you tour the home.