Estimated Value: $450,000 - $507,000
5
Beds
3
Baths
2,416
Sq Ft
$201/Sq Ft
Est. Value
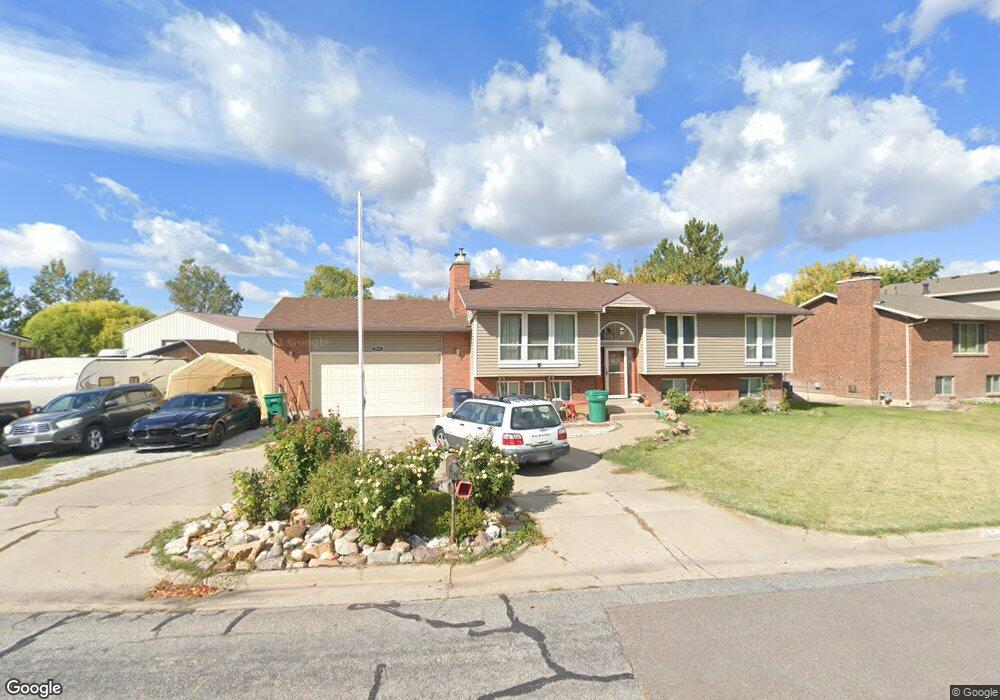
About This Home
This home is located at 5931 S 3750 W, Roy, UT 84067 and is currently estimated at $485,576, approximately $200 per square foot. 5931 S 3750 W is a home located in Weber County with nearby schools including Midland School, Roy Junior High School, and Roy High School.
Ownership History
Date
Name
Owned For
Owner Type
Purchase Details
Closed on
Jul 12, 2022
Sold by
Chadbourne Sean C and Chadbourne Sherry L
Bought by
Herre David Allen and Herre Kirstin Kayla
Current Estimated Value
Home Financials for this Owner
Home Financials are based on the most recent Mortgage that was taken out on this home.
Original Mortgage
$442,831
Outstanding Balance
$421,340
Interest Rate
5.1%
Mortgage Type
FHA
Estimated Equity
$64,236
Purchase Details
Closed on
Oct 27, 2006
Sold by
Wickham Donald R and Wickham Lamyai
Bought by
Chadbourne Sean C and Chadbourne Sherry L
Home Financials for this Owner
Home Financials are based on the most recent Mortgage that was taken out on this home.
Original Mortgage
$161,400
Interest Rate
6.39%
Mortgage Type
Purchase Money Mortgage
Create a Home Valuation Report for This Property
The Home Valuation Report is an in-depth analysis detailing your home's value as well as a comparison with similar homes in the area
Home Values in the Area
Average Home Value in this Area
Purchase History
| Date | Buyer | Sale Price | Title Company |
|---|---|---|---|
| Herre David Allen | -- | Inwest Title | |
| Chadbourne Sean C | -- | First American Title |
Source: Public Records
Mortgage History
| Date | Status | Borrower | Loan Amount |
|---|---|---|---|
| Open | Herre David Allen | $442,831 | |
| Previous Owner | Chadbourne Sean C | $161,400 |
Source: Public Records
Tax History Compared to Growth
Tax History
| Year | Tax Paid | Tax Assessment Tax Assessment Total Assessment is a certain percentage of the fair market value that is determined by local assessors to be the total taxable value of land and additions on the property. | Land | Improvement |
|---|---|---|---|---|
| 2025 | $2,883 | $454,411 | $149,317 | $305,094 |
| 2024 | $2,817 | $245,849 | $82,140 | $163,709 |
| 2023 | $2,712 | $237,050 | $82,067 | $154,983 |
| 2022 | $2,696 | $241,450 | $68,505 | $172,945 |
| 2021 | $2,336 | $345,000 | $84,681 | $260,319 |
| 2020 | $2,125 | $287,000 | $84,681 | $202,319 |
| 2019 | $2,064 | $263,000 | $54,821 | $208,179 |
| 2018 | $1,920 | $230,000 | $49,810 | $180,190 |
| 2017 | $1,659 | $184,000 | $44,780 | $139,220 |
| 2016 | $1,663 | $99,946 | $24,586 | $75,360 |
| 2015 | $1,465 | $89,353 | $21,837 | $67,516 |
| 2014 | $1,445 | $87,275 | $21,837 | $65,438 |
Source: Public Records
Map
Nearby Homes