Estimated Value: $342,000 - $360,000
3
Beds
1
Bath
1,482
Sq Ft
$236/Sq Ft
Est. Value
About This Home
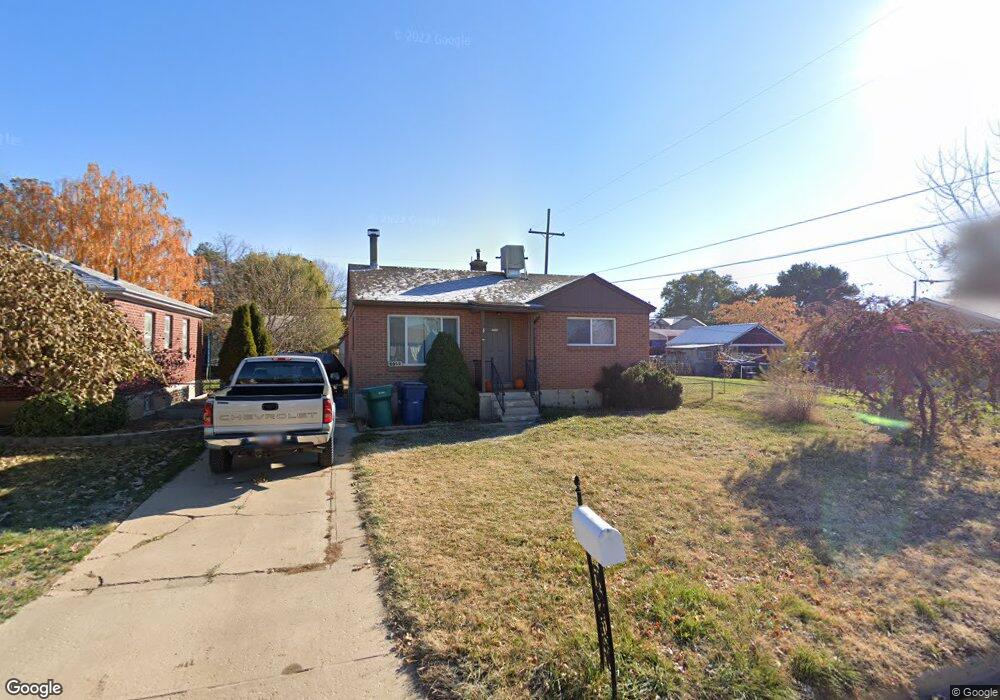
This home is located at 5932 S 2600 W, Roy, UT 84067 and is currently estimated at $349,489, approximately $235 per square foot. 5932 S 2600 W is a home located in Weber County with nearby schools including Municipal School, Roy Junior High School, and Roy High School.
Ownership History
Date
Name
Owned For
Owner Type
Purchase Details
Closed on
Feb 25, 2021
Sold by
Canyon Advantage Llc
Bought by
Clegg Kelsie
Current Estimated Value
Home Financials for this Owner
Home Financials are based on the most recent Mortgage that was taken out on this home.
Original Mortgage
$18,045
Outstanding Balance
$16,249
Interest Rate
2.97%
Mortgage Type
New Conventional
Estimated Equity
$333,240
Purchase Details
Closed on
Sep 21, 2020
Sold by
Tom Christopher
Bought by
Canyon Advantage Llc
Purchase Details
Closed on
Jun 7, 2017
Sold by
Whipple Lauren
Bought by
Tom Christopher
Home Financials for this Owner
Home Financials are based on the most recent Mortgage that was taken out on this home.
Original Mortgage
$142,500
Interest Rate
4.03%
Mortgage Type
New Conventional
Purchase Details
Closed on
Jul 14, 2014
Sold by
Martin Joseph
Bought by
Whipple Lauren
Home Financials for this Owner
Home Financials are based on the most recent Mortgage that was taken out on this home.
Original Mortgage
$108,007
Interest Rate
3.87%
Mortgage Type
FHA
Purchase Details
Closed on
Dec 5, 2003
Sold by
Home & Property Solutions Inc
Bought by
Martin Joseph
Home Financials for this Owner
Home Financials are based on the most recent Mortgage that was taken out on this home.
Original Mortgage
$87,400
Interest Rate
5.92%
Mortgage Type
Seller Take Back
Purchase Details
Closed on
Sep 19, 2003
Sold by
Hud
Bought by
Home & Property Solutions Inc
Home Financials for this Owner
Home Financials are based on the most recent Mortgage that was taken out on this home.
Original Mortgage
$75,190
Interest Rate
6.3%
Mortgage Type
Balloon
Purchase Details
Closed on
May 5, 2003
Sold by
Countrywide Home Loans Inc
Bought by
Hud
Purchase Details
Closed on
Apr 22, 2003
Sold by
Weber Michael T
Bought by
Countrywide Home Loans Inc
Purchase Details
Closed on
Feb 26, 2001
Sold by
Gross Tricia L and Grover David L
Bought by
Weber Michael T
Home Financials for this Owner
Home Financials are based on the most recent Mortgage that was taken out on this home.
Original Mortgage
$106,300
Interest Rate
6.89%
Mortgage Type
FHA
Purchase Details
Closed on
Aug 13, 1996
Sold by
Morris Julie L
Bought by
Gross Tricia L and Grover David L
Home Financials for this Owner
Home Financials are based on the most recent Mortgage that was taken out on this home.
Original Mortgage
$74,847
Interest Rate
8.18%
Mortgage Type
FHA
Create a Home Valuation Report for This Property
The Home Valuation Report is an in-depth analysis detailing your home's value as well as a comparison with similar homes in the area
Home Values in the Area
Average Home Value in this Area
Purchase History
| Date | Buyer | Sale Price | Title Company |
|---|---|---|---|
| Clegg Kelsie | -- | Title Guarantee River Park | |
| Canyon Advantage Llc | -- | Truly Title Inc | |
| Tom Christopher | -- | Metro National Title | |
| Whipple Lauren | -- | Bonneville Superior Title Co | |
| Martin Joseph | -- | Title West | |
| Home & Property Solutions Inc | -- | Us Title | |
| Hud | -- | First American Title | |
| Countrywide Home Loans Inc | $114,972 | First American Title | |
| Weber Michael T | -- | -- | |
| Gross Tricia L | -- | Bonneville Title Company |
Source: Public Records
Mortgage History
| Date | Status | Borrower | Loan Amount |
|---|---|---|---|
| Open | Clegg Kelsie | $18,045 | |
| Open | Clegg Kelsie | $300,751 | |
| Previous Owner | Tom Christopher | $142,500 | |
| Previous Owner | Whipple Lauren | $108,007 | |
| Previous Owner | Martin Joseph | $87,400 | |
| Previous Owner | Home & Property Solutions Inc | $75,190 | |
| Previous Owner | Weber Michael T | $106,300 | |
| Previous Owner | Gross Tricia L | $74,847 |
Source: Public Records
Tax History
| Year | Tax Paid | Tax Assessment Tax Assessment Total Assessment is a certain percentage of the fair market value that is determined by local assessors to be the total taxable value of land and additions on the property. | Land | Improvement |
|---|---|---|---|---|
| 2025 | $2,043 | $313,624 | $95,215 | $218,409 |
| 2024 | $1,975 | $167,749 | $52,376 | $115,373 |
| 2023 | $1,902 | $161,700 | $53,638 | $108,062 |
| 2022 | $2,126 | $189,200 | $49,858 | $139,342 |
| 2021 | $1,611 | $232,000 | $58,268 | $173,732 |
| 2020 | $1,445 | $190,000 | $58,268 | $131,732 |
| 2019 | $1,491 | $186,000 | $34,683 | $151,317 |
| 2018 | $1,300 | $150,000 | $30,008 | $119,992 |
| 2017 | $1,133 | $120,000 | $30,008 | $89,992 |
| 2016 | $1,089 | $61,913 | $17,228 | $44,685 |
| 2015 | $994 | $57,212 | $19,813 | $37,399 |
| 2014 | $978 | $55,559 | $14,630 | $40,929 |
Source: Public Records
Map
Nearby Homes
Your Personal Tour Guide
Ask me questions while you tour the home.