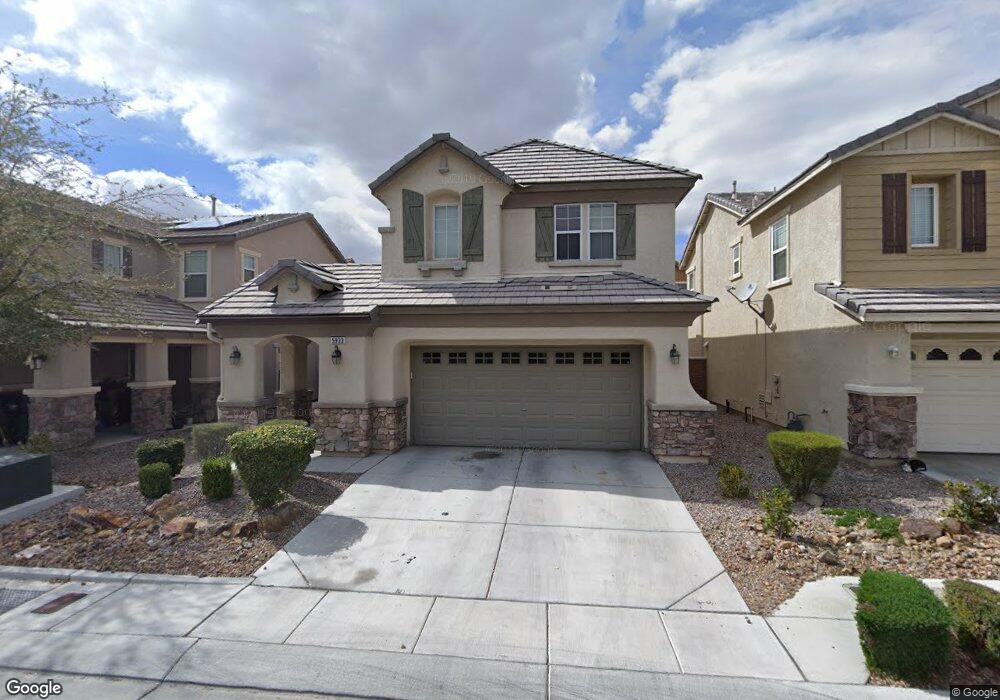
5933 Feral Garden St North Las Vegas, NV 89031
Craig Ranch NeighborhoodEstimated Value: $376,000 - $390,000
3
Beds
3
Baths
1,622
Sq Ft
$236/Sq Ft
Est. Value
About This Home
This home is located at 5933 Feral Garden St, North Las Vegas, NV 89031 and is currently estimated at $383,124, approximately $236 per square foot. 5933 Feral Garden St is a home located in Clark County with nearby schools including Fredric W. Watson Elementary School, Clifford O. Findlay Middle School, and Legacy High School.
Ownership History
Date
Name
Owned For
Owner Type
Purchase Details
Closed on
May 1, 2009
Sold by
Us Bank National Association
Bought by
Cobbins Sheree M
Current Estimated Value
Home Financials for this Owner
Home Financials are based on the most recent Mortgage that was taken out on this home.
Original Mortgage
$109,087
Outstanding Balance
$68,589
Interest Rate
4.76%
Mortgage Type
FHA
Estimated Equity
$314,535
Purchase Details
Closed on
Aug 14, 2008
Sold by
Mendoza Baltazar and Tapia Teresa
Bought by
Lasalle Bank Na and Ownit Mtg Loan Tr Mtg Loan Asset Backed
Purchase Details
Closed on
Jul 25, 2006
Sold by
Kb Home Nevada Inc
Bought by
Mendoza Baltazar and Tapia Teresa
Home Financials for this Owner
Home Financials are based on the most recent Mortgage that was taken out on this home.
Original Mortgage
$209,800
Interest Rate
7.87%
Mortgage Type
Balloon
Purchase Details
Closed on
Mar 13, 2006
Sold by
Hearthstone Multi Asset Entity B Lp
Bought by
Kb Home Nevada Inc
Create a Home Valuation Report for This Property
The Home Valuation Report is an in-depth analysis detailing your home's value as well as a comparison with similar homes in the area
Home Values in the Area
Average Home Value in this Area
Purchase History
| Date | Buyer | Sale Price | Title Company |
|---|---|---|---|
| Cobbins Sheree M | $111,100 | Lawyers Title Of Nevada West | |
| Lasalle Bank Na | $159,600 | Lsi Title Agency Inc | |
| Mendoza Baltazar | $262,260 | First Amer Title Co Of Nv | |
| Kb Home Nevada Inc | $3,015,092 | First Amer Title Co Of Nv |
Source: Public Records
Mortgage History
| Date | Status | Borrower | Loan Amount |
|---|---|---|---|
| Open | Cobbins Sheree M | $109,087 | |
| Previous Owner | Mendoza Baltazar | $209,800 |
Source: Public Records
Tax History Compared to Growth
Tax History
| Year | Tax Paid | Tax Assessment Tax Assessment Total Assessment is a certain percentage of the fair market value that is determined by local assessors to be the total taxable value of land and additions on the property. | Land | Improvement |
|---|---|---|---|---|
| 2025 | $1,305 | $106,690 | $31,150 | $75,540 |
| 2024 | $1,268 | $106,690 | $31,150 | $75,540 |
| 2023 | $1,268 | $101,431 | $30,100 | $71,331 |
| 2022 | $1,231 | $88,119 | $23,100 | $65,019 |
| 2021 | $1,195 | $83,183 | $21,350 | $61,833 |
| 2020 | $1,158 | $82,464 | $21,350 | $61,114 |
| 2019 | $1,124 | $75,261 | $18,900 | $56,361 |
| 2018 | $1,091 | $66,311 | $15,750 | $50,561 |
| 2017 | $1,856 | $55,237 | $14,000 | $41,237 |
| 2016 | $1,034 | $48,145 | $10,150 | $37,995 |
| 2015 | $1,031 | $37,042 | $7,000 | $30,042 |
| 2014 | $1,001 | $28,872 | $4,900 | $23,972 |
Source: Public Records
Map
Nearby Homes
- 5921 Magic Oak St
- 12 Copper Pine Ave
- 5929 Pink Chaff St
- 104 Big Cliff Ave
- 6046 Hidden Summit St
- 209 Copper Pine Ave
- 6084 Silken Saddle St
- 210 Mountain Cedar Ct
- 305 Snow Dome Ave
- 5929 Caddy Ridge St
- 326 Caneflower Ct
- 221 Mountain Cedar Ct
- 129 Thorntree Ave
- 5908 Big Horn View St
- 351 Caneflower Ct
- 5640 Vermillion Ridge St
- 138 Scarlett View Ave
- 309 Maritocca Ave
- 5703 Salt Rock St
- 5824 Gemstone Peak St
- 5929 Feral Garden St
- 5937 Feral Garden St
- 5941 Feral Garden St
- 5925 Feral Garden St
- 5928 Post Mountain St
- 5932 Post Mountain St
- 5924 Post Mountain St
- 37 Focal Point Ave
- 5936 Post Mountain St
- 5945 Feral Garden St
- 5936 Feral Garden St
- 5921 Feral Garden St
- 5920 Post Mountain St
- 5940 Post Mountain St
- 5940 Feral Garden St
- 33 Focal Point Ave Unit n
- 36 Marble Apex Ave
- 5949 Feral Garden St
- 5917 Feral Garden St