5935 Colt Ct Rancho Cucamonga, CA 91739
Etiwanda NeighborhoodEstimated Value: $1,336,596 - $1,431,000
About This Home
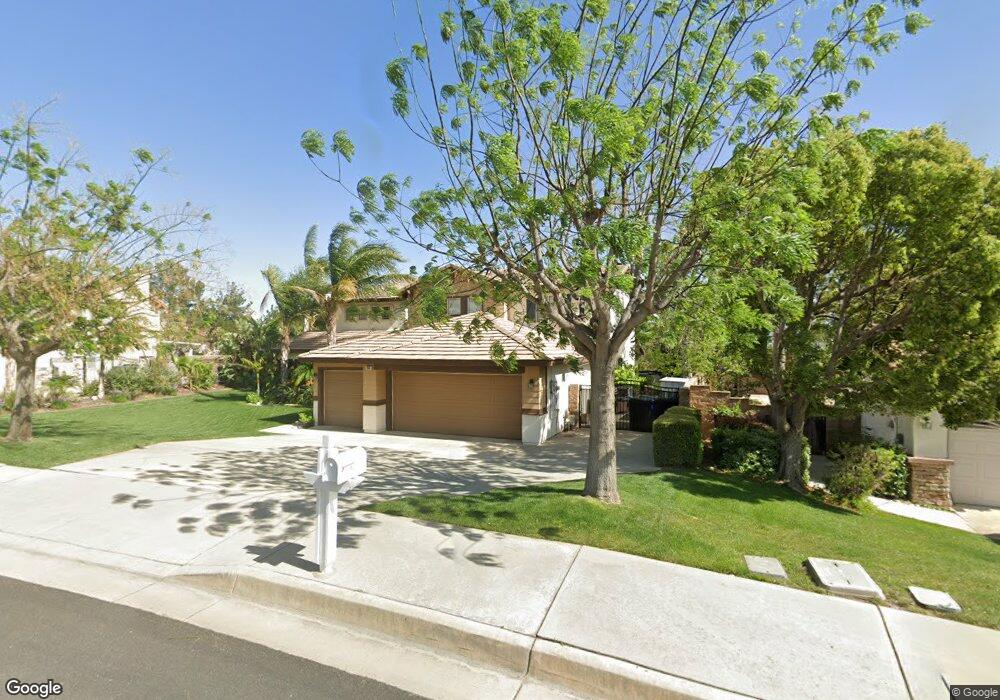
This home is located at 5935 Colt Ct, Rancho Cucamonga, CA 91739 and is currently estimated at $1,400,899, approximately $409 per square foot. 5935 Colt Ct is a home located in San Bernardino County with nearby schools including John L. Golden Elementary, Day Creek Intermediate, and Los Osos High.
Ownership History
We collect this data history from publicly available records. To have your information removed, we recommend requesting removal directly through your county’s website.
Purchase Details
Home Financials for this Owner
Home Financials are based on the most recent Mortgage that was taken out on this home.Purchase Details
Purchase Details
Home Financials for this Owner
Home Financials are based on the most recent Mortgage that was taken out on this home.Home Values in the Area
Average Home Value in this Area
Purchase History
We collect this data history from publicly available records. To have your information removed, we recommend requesting removal directly through your county’s website.
| Date | Buyer | Sale Price | Title Company |
|---|---|---|---|
| -- | American Title-Orange | ||
| $378,000 | Orange Coast Title | ||
| $371,000 | Fidelity National Title |
Mortgage History
We collect this data history from publicly available records. To have your information removed, we recommend requesting removal directly through your county’s website.
| Date | Status | Borrower | Loan Amount |
|---|---|---|---|
| Open | $415,000 | ||
| Previous Owner | $352,000 |
Tax History
We collect this data history from publicly available records. To have your information removed, we recommend requesting removal directly through your county’s website.
| Year | Tax Paid | Tax Assessment Tax Assessment Total Assessment is a certain percentage of the fair market value that is determined by local assessors to be the total taxable value of land and additions on the property. | Land | Improvement |
|---|---|---|---|---|
| 2025 | $7,265 | $630,966 | $145,249 | $485,717 |
| 2024 | $7,072 | $618,594 | $142,401 | $476,193 |
| 2023 | $6,908 | $606,465 | $139,609 | $466,856 |
| 2022 | $6,832 | $594,574 | $136,872 | $457,702 |
| 2021 | $6,721 | $582,915 | $134,188 | $448,727 |
| 2020 | $6,636 | $576,938 | $132,812 | $444,126 |
| 2019 | $6,461 | $565,626 | $130,208 | $435,418 |
| 2018 | $6,675 | $554,535 | $127,655 | $426,880 |
| 2017 | $6,392 | $543,662 | $125,152 | $418,510 |
| 2016 | $6,227 | $533,002 | $122,698 | $410,304 |
| 2015 | $6,188 | $524,996 | $120,855 | $404,141 |
| 2014 | $6,036 | $514,712 | $118,488 | $396,224 |
Map
- 5606 E Overlook Dr
- 13123 Carriage Trail Ct
- 12858 Putney Ct
- 13113 Edgware Dr
- 5610 Rocky Shores Place
- 12891 Putney Ct
- 13083 Edgware Dr
- 12871 Putney Ct
- 13093 Edgware Dr
- 12993 Edgware Dr
- 5604 Rocky Shores Place
- 13073 Edgware Dr
- 13053 Edgware Dr
- 12848 Putney Ct
- 5737 Rosecroft Ct
- 12816 Windstar Dr
- 12661 Ridgecrest Dr
- 12452 Challendon Dr
- 5526 Cheyenne Ct
- 12430 Split Rein Dr
- 5921 Colt Ct
- 5949 Colt Ct
- 12860 E Rancho Estates Place
- 12840 E Rancho Estates Place
- 5906 Etiwanda Ave
- 12880 E Rancho Estates Place
- 5930 Etiwanda Ave
- 5907 Colt Ct
- 12820 E Rancho Estates Place
- 5938 Colt Ct
- 12800 E Rancho Estates Place
- 5882 Etiwanda Ave
- 5954 Etiwanda Ave
- 5906 Colt Ct
- 5918 Colt Ct
- 12788 E Rancho Estates Place
- 5910 Colt Ct
- 12770 E Rancho Estates Place
- 5858 Etiwanda Ave
- 12861 E Rancho Estates Place
Ask me questions while you tour the home.