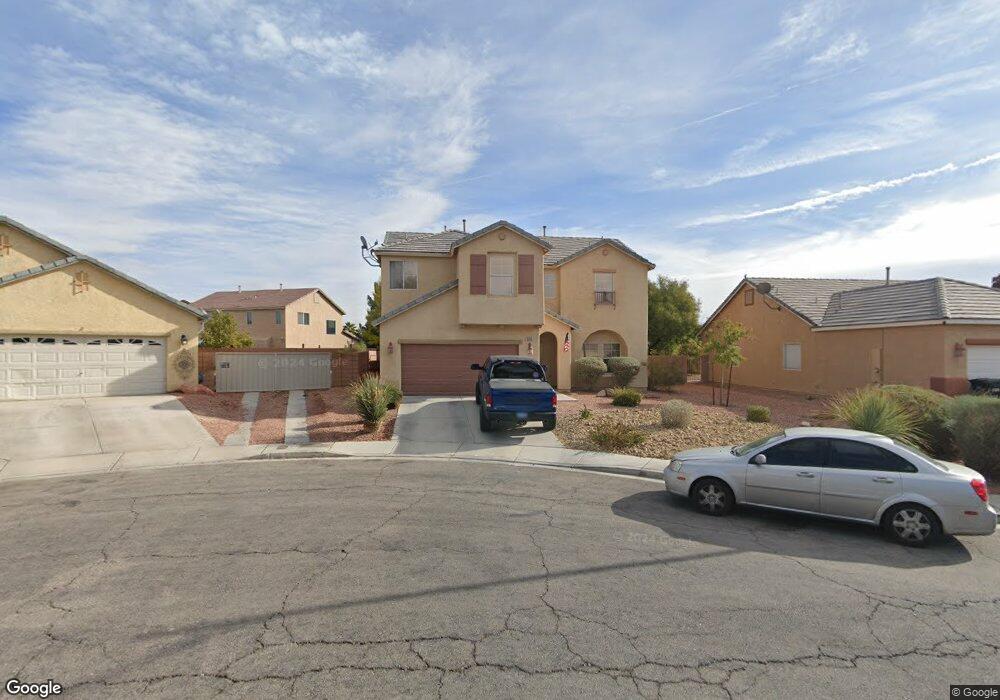
5936 Beeline Ct North Las Vegas, NV 89031
Craig Ranch NeighborhoodEstimated Value: $313,000 - $437,000
4
Beds
3
Baths
1,935
Sq Ft
$205/Sq Ft
Est. Value
About This Home
This home is located at 5936 Beeline Ct, North Las Vegas, NV 89031 and is currently estimated at $395,808, approximately $204 per square foot. 5936 Beeline Ct is a home located in Clark County with nearby schools including Eva G. Simmons Elementary School, Brian & Teri Cram Middle School, and Legacy High School.
Ownership History
Date
Name
Owned For
Owner Type
Purchase Details
Closed on
Feb 4, 2004
Sold by
United Capital Mortgage Corp
Bought by
Stroud Michael R and Stroud Lisa M
Current Estimated Value
Home Financials for this Owner
Home Financials are based on the most recent Mortgage that was taken out on this home.
Original Mortgage
$116,400
Outstanding Balance
$45,669
Interest Rate
3.5%
Mortgage Type
Seller Take Back
Estimated Equity
$350,139
Purchase Details
Closed on
Apr 18, 2003
Sold by
Combs James E and Combs Sherrie L
Bought by
United Capital Mortgage Corp
Purchase Details
Closed on
Mar 16, 2000
Sold by
Richmond American Homes Of Nevada Inc
Bought by
Combs James E and Combs Sherrie L
Home Financials for this Owner
Home Financials are based on the most recent Mortgage that was taken out on this home.
Original Mortgage
$149,326
Interest Rate
8.22%
Mortgage Type
VA
Create a Home Valuation Report for This Property
The Home Valuation Report is an in-depth analysis detailing your home's value as well as a comparison with similar homes in the area
Home Values in the Area
Average Home Value in this Area
Purchase History
| Date | Buyer | Sale Price | Title Company |
|---|---|---|---|
| Stroud Michael R | $145,500 | Lawyers Title Of Nevada | |
| United Capital Mortgage Corp | $136,602 | Land Title Of Nevada | |
| Combs James E | $144,978 | Old Republic Title Company |
Source: Public Records
Mortgage History
| Date | Status | Borrower | Loan Amount |
|---|---|---|---|
| Open | Stroud Michael R | $116,400 | |
| Previous Owner | Combs James E | $149,326 | |
| Closed | Stroud Michael R | $21,825 |
Source: Public Records
Tax History Compared to Growth
Tax History
| Year | Tax Paid | Tax Assessment Tax Assessment Total Assessment is a certain percentage of the fair market value that is determined by local assessors to be the total taxable value of land and additions on the property. | Land | Improvement |
|---|---|---|---|---|
| 2025 | $1,909 | $101,434 | $32,900 | $68,534 |
| 2024 | $1,768 | $101,434 | $32,900 | $68,534 |
| 2023 | $1,768 | $97,148 | $32,200 | $64,948 |
| 2022 | $1,637 | $85,996 | $26,600 | $59,396 |
| 2021 | $1,516 | $77,906 | $21,350 | $56,556 |
| 2020 | $1,405 | $78,183 | $22,050 | $56,133 |
| 2019 | $1,317 | $74,078 | $18,900 | $55,178 |
| 2018 | $1,256 | $68,226 | $15,400 | $52,826 |
| 2017 | $2,229 | $66,463 | $12,950 | $53,513 |
| 2016 | $1,177 | $56,375 | $8,750 | $47,625 |
| 2015 | $1,174 | $41,830 | $7,000 | $34,830 |
| 2014 | $1,139 | $35,077 | $7,700 | $27,377 |
Source: Public Records
Map
Nearby Homes
- 5930 Abyss Ct
- 3106 Saleen Ct
- 2707 Gardenia Flower Ave
- 3114 Mastercraft Ave
- 3021 New Journey Way
- 2610 Gardenia Flower Ave
- 3405 Red Fire Ave
- 6140 Passionate Ct
- 3107 Sunrise Cove Ave
- 2426 Inlet Beach Ct
- 3304 W El Campo Grande Ave
- 6032 Glitter Gold Ct
- 2716 Orchid Moon Ct
- 3214 Inlet Bay Ave
- 3123 Inlet Bay Ave
- 3509 Red Fire Ave
- 3217 Palladio Ave
- 3513 Mastercraft Ave
- 3604 Sandy Brown Ave
- 3412 Sunrise Rose Ave
- 5932 Beeline Ct
- 5937 Abyss Ct
- 5940 Beeline Ct Unit 3
- 5933 Abyss Ct
- 5928 Beeline Ct
- 5941 Abyss Ct
- 5929 Abyss Ct
- 5943 Beeline Ct
- 5935 Beeline Ct
- 5931 Beeline Ct
- 5924 Beeline Ct
- 5939 Beeline Ct
- 5945 Abyss Ct
- 5925 Abyss Ct
- 5927 Beeline Ct
- 5923 Beeline Ct
- 5934 Abyss Ct
- 5942 Abyss Ct
- 5934 Gingham St
- 5930 Gingham St