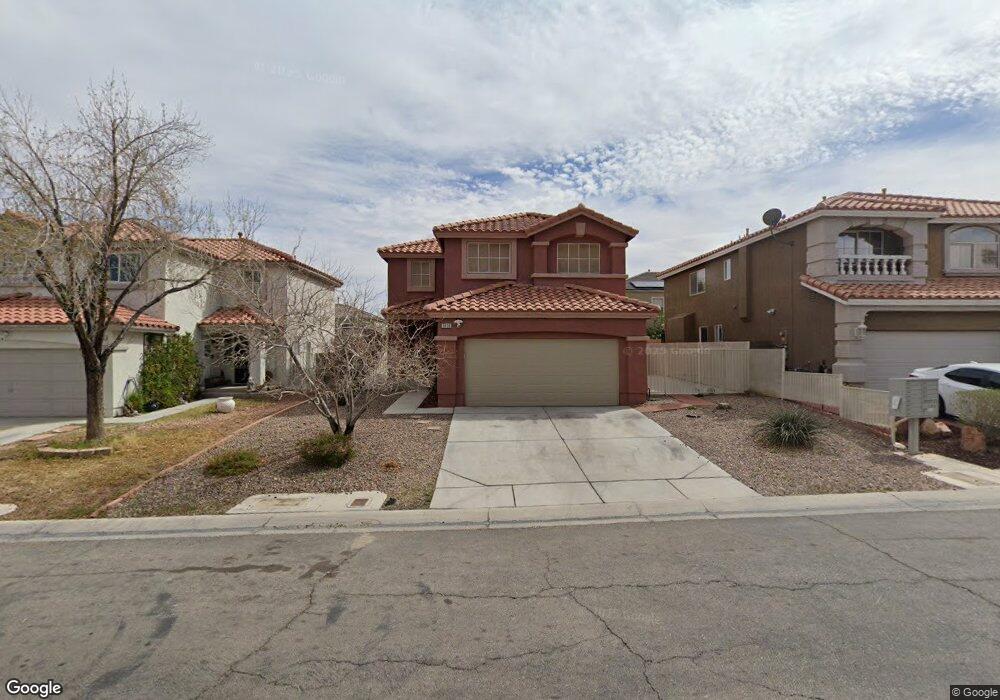
5936 Fly Fisher St Las Vegas, NV 89113
Estimated Value: $436,000 - $444,000
3
Beds
3
Baths
1,553
Sq Ft
$284/Sq Ft
Est. Value
About This Home
This home is located at 5936 Fly Fisher St, Las Vegas, NV 89113 and is currently estimated at $440,413, approximately $283 per square foot. 5936 Fly Fisher St is a home located in Clark County with nearby schools including Lucille S. Rogers Elementary School, Grant Sawyer Middle School, and Durango High School.
Ownership History
Date
Name
Owned For
Owner Type
Purchase Details
Closed on
Dec 3, 2008
Sold by
Us Bank National Association
Bought by
Griffin Mechele L
Current Estimated Value
Home Financials for this Owner
Home Financials are based on the most recent Mortgage that was taken out on this home.
Original Mortgage
$174,265
Outstanding Balance
$114,976
Interest Rate
6.1%
Mortgage Type
FHA
Estimated Equity
$325,437
Purchase Details
Closed on
May 1, 2008
Sold by
Ocampo Albert
Bought by
Us Bank Na and Holders Of The Asset Backed Securities C
Purchase Details
Closed on
Sep 8, 2006
Sold by
Ocampo Melanie
Bought by
Ocampo Albert
Home Financials for this Owner
Home Financials are based on the most recent Mortgage that was taken out on this home.
Original Mortgage
$332,500
Interest Rate
9.55%
Mortgage Type
Unknown
Purchase Details
Closed on
Oct 28, 1999
Sold by
American West Homes Inc
Bought by
Gamboa Israel P and Gamboa Romely L
Home Financials for this Owner
Home Financials are based on the most recent Mortgage that was taken out on this home.
Original Mortgage
$126,300
Interest Rate
7.68%
Create a Home Valuation Report for This Property
The Home Valuation Report is an in-depth analysis detailing your home's value as well as a comparison with similar homes in the area
Home Values in the Area
Average Home Value in this Area
Purchase History
| Date | Buyer | Sale Price | Title Company |
|---|---|---|---|
| Griffin Mechele L | $177,020 | Lsi Title Agency Inc | |
| Us Bank Na | $249,023 | Fidelity National | |
| Ocampo Albert | -- | National Alliance Title | |
| Ocampo Albert | $350,000 | National Alliance Title | |
| Gamboa Israel P | $133,800 | First American Title Co |
Source: Public Records
Mortgage History
| Date | Status | Borrower | Loan Amount |
|---|---|---|---|
| Open | Griffin Mechele L | $174,265 | |
| Previous Owner | Ocampo Albert | $332,500 | |
| Previous Owner | Gamboa Israel P | $126,300 |
Source: Public Records
Tax History Compared to Growth
Tax History
| Year | Tax Paid | Tax Assessment Tax Assessment Total Assessment is a certain percentage of the fair market value that is determined by local assessors to be the total taxable value of land and additions on the property. | Land | Improvement |
|---|---|---|---|---|
| 2025 | $1,499 | $105,229 | $45,500 | $59,729 |
| 2024 | $1,456 | $105,229 | $45,500 | $59,729 |
| 2023 | $1,456 | $97,157 | $40,600 | $56,557 |
| 2022 | $1,414 | $81,466 | $29,750 | $51,716 |
| 2021 | $1,373 | $78,639 | $29,400 | $49,239 |
| 2020 | $1,330 | $75,798 | $26,950 | $48,848 |
| 2019 | $1,291 | $71,159 | $23,100 | $48,059 |
| 2018 | $1,253 | $66,076 | $19,950 | $46,126 |
| 2017 | $1,905 | $64,949 | $18,200 | $46,749 |
| 2016 | $1,188 | $59,808 | $14,000 | $45,808 |
| 2015 | $1,185 | $46,464 | $10,500 | $35,964 |
| 2014 | $1,150 | $38,039 | $7,700 | $30,339 |
Source: Public Records
Map
Nearby Homes
- 5835 Rainbow Trout Ct
- Kaufman Plan at Tenaya Springs
- Avondale Plan at Tenaya Springs
- Lovell Plan at Tenaya Springs
- 8555 W Russell Rd Unit 1078
- 8555 W Russell Rd Unit 1026
- 8162 Seminario Ave
- 6128 Stetson Cove Ct
- 5766 Whimsical St
- 5762 Whimsical St
- 6168 Stetson Cove Ct
- 5758 Whimsical St
- 5754 Whimsical St
- 5750 Whimsical St
- 5746 Whimsical St
- 6161 Andover Wood Rd
- 5742 Whimsical St
- Barclay Plan at Majestic Point South
- Bedford Plan at Majestic Point South
- Griffin Plan at Majestic Point South
- 5944 Fly Fisher St
- 5944 Fly Fisher St Unit n/a
- 5928 Fly Fisher St
- 8388 Baden Westwood Ln
- 5952 Fly Fisher St
- 5920 Fly Fisher St
- 5920 Fly Fisher St Unit n/a
- 5941 Chatsworth Hill St
- 8407 Prince of Tides Ct
- 8382 Baden Westwood Ln
- 5912 Fly Fisher St
- 5960 Fly Fisher St
- 5960 Fly Fisher St Unit na
- 8406 Tackle Box Ct
- 5933 Chatsworth Hill St
- 5925 Chatsworth Hill St
- 8376 Baden Westwood Ln
- 8417 Prince of Tides Ct
- 8391 W Oquendo Rd
- 5968 Fly Fisher St