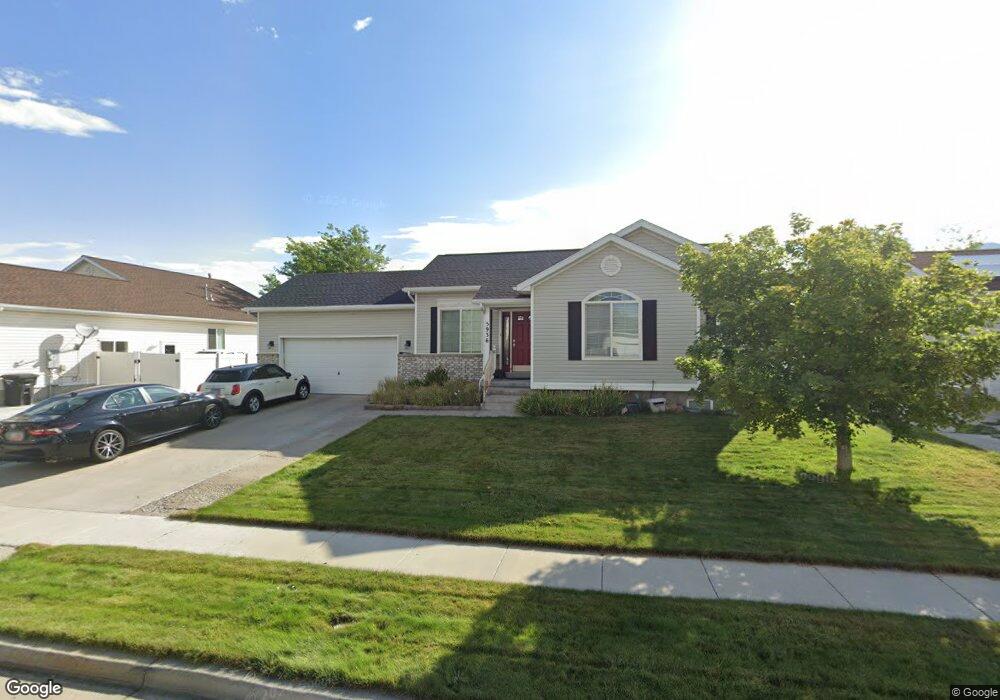
5936 Genoa Ln Tooele, UT 84074
Estimated Value: $415,000 - $460,000
4
Beds
2
Baths
1,864
Sq Ft
$235/Sq Ft
Est. Value
About This Home
This home is located at 5936 Genoa Ln, Tooele, UT 84074 and is currently estimated at $437,312, approximately $234 per square foot. 5936 Genoa Ln is a home located in Tooele County with nearby schools including Stansbury Park Elementary School, Clarke N. Johnsen Junior High School, and Stansbury High School.
Ownership History
Date
Name
Owned For
Owner Type
Purchase Details
Closed on
Mar 27, 2015
Sold by
Williams Vicki L
Bought by
Williams Vicky L and Williams Ronald L
Current Estimated Value
Home Financials for this Owner
Home Financials are based on the most recent Mortgage that was taken out on this home.
Original Mortgage
$190,816
Outstanding Balance
$147,000
Interest Rate
3.76%
Mortgage Type
New Conventional
Estimated Equity
$290,312
Purchase Details
Closed on
Apr 12, 2006
Sold by
Allred Jared
Bought by
Holley Carlos
Home Financials for this Owner
Home Financials are based on the most recent Mortgage that was taken out on this home.
Original Mortgage
$122,400
Interest Rate
6.2%
Mortgage Type
New Conventional
Create a Home Valuation Report for This Property
The Home Valuation Report is an in-depth analysis detailing your home's value as well as a comparison with similar homes in the area
Home Values in the Area
Average Home Value in this Area
Purchase History
| Date | Buyer | Sale Price | Title Company |
|---|---|---|---|
| Williams Vicky L | -- | Equity Title | |
| Williams Vicki L | -- | Tooele Title Company | |
| Holley Carlos | -- | Integrated Title Ins Service |
Source: Public Records
Mortgage History
| Date | Status | Borrower | Loan Amount |
|---|---|---|---|
| Open | Williams Vicki L | $190,816 | |
| Previous Owner | Holley Carlos | $122,400 |
Source: Public Records
Tax History
| Year | Tax Paid | Tax Assessment Tax Assessment Total Assessment is a certain percentage of the fair market value that is determined by local assessors to be the total taxable value of land and additions on the property. | Land | Improvement |
|---|---|---|---|---|
| 2025 | $3,146 | $397,648 | $140,000 | $257,648 |
| 2024 | $3,543 | $227,596 | $77,000 | $150,596 |
| 2023 | $3,543 | $254,481 | $79,750 | $174,731 |
| 2022 | $2,679 | $214,974 | $70,950 | $144,024 |
| 2021 | $2,370 | $157,087 | $57,200 | $99,887 |
| 2020 | $2,260 | $261,887 | $80,000 | $181,887 |
| 2019 | $2,105 | $239,917 | $80,000 | $159,917 |
| 2018 | $1,936 | $211,438 | $40,000 | $171,438 |
| 2017 | $1,696 | $195,853 | $40,000 | $155,853 |
| 2016 | $1,378 | $96,538 | $22,000 | $74,538 |
| 2015 | $1,378 | $86,497 | $0 | $0 |
| 2014 | -- | $86,497 | $0 | $0 |
Source: Public Records
Map
Nearby Homes
- 796 Lakeview Dr
- 152 W Regatta Ln
- 5757 Mast Ln
- 208 Lakeview Dr
- 109 Nautical Dr
- 138 W Morning Glory Cir
- 118 W Morning Glory Cir
- 700 Country Club Dr
- 93 Spyglass Dr
- 5778 Parkview Dr
- 133 W Marigold Cir Unit 311
- 5531 Ponderosa Ln
- 5945 N Spring St
- 365 W Box Creek Dr
- 863 Country Club Dr
- 622 W Lafayette St
- 776 Country Club Dr
- 6412 N Wild Mare Way Unit 1022
- 1006 W Peregrine Dr
- 5640 N Parkview Dr
- 5926 Genoa Ln
- 5946 Genoa Ln
- 5946 Genoa Ln Unit 39
- 5975 Yachtsman Ln
- 5967 Yachtsman Ln
- 5979 Yachtsman Ln
- 5914 Genoa Ln
- 5958 Genoa Ln
- 5951 Genoa Ln
- 5961 Yachtsman Ln
- 5957 Genoa Ln
- 5943 Genoa Ln
- 5985 Yachtsman Ln
- 5965 Genoa Ln
- 5968 Genoa Ln
- 5935 Genoa Ln
- 5904 Genoa Ln
- 5995 Yachtsman Ln
- 5995 Yachtsman Ln
- 5926 Windsong Dr
Your Personal Tour Guide
Ask me questions while you tour the home.