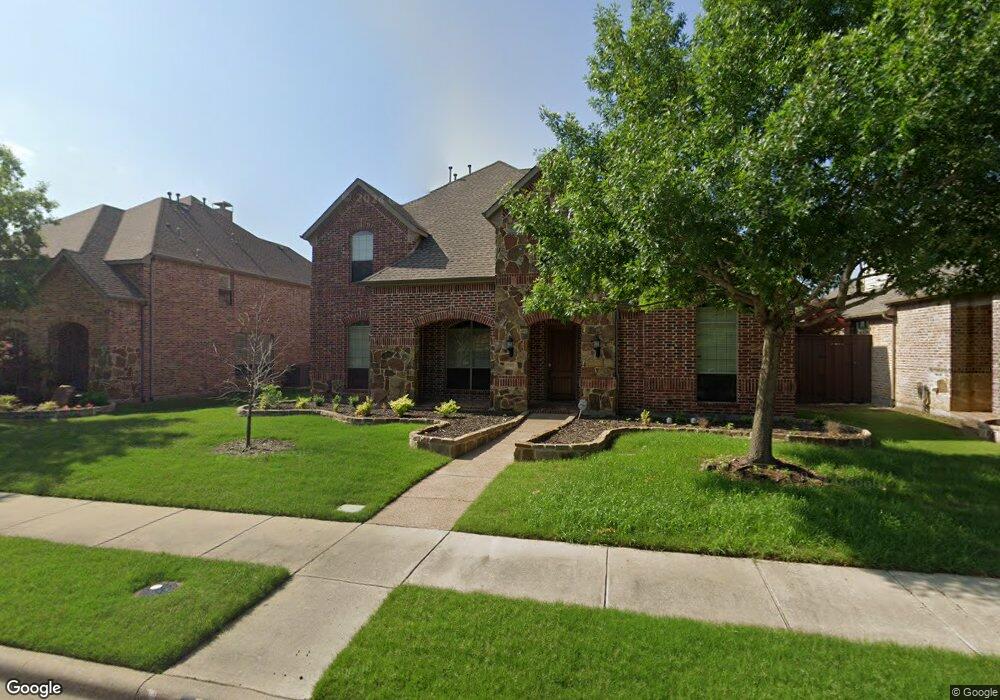
5937 Haverhill Ln Frisco, TX 75033
Northwest Frisco NeighborhoodEstimated Value: $680,000 - $757,000
5
Beds
4
Baths
4,007
Sq Ft
$178/Sq Ft
Est. Value
About This Home
This home is located at 5937 Haverhill Ln, Frisco, TX 75033 and is currently estimated at $712,235, approximately $177 per square foot. 5937 Haverhill Ln is a home located in Collin County with nearby schools including Rogers Elementary, Staley Middle, and Memorial High School.
Ownership History
Date
Name
Owned For
Owner Type
Purchase Details
Closed on
Nov 17, 2011
Sold by
Jacobs Alex and Jacobs Courtney
Bought by
Martinez Joseph Diego
Current Estimated Value
Home Financials for this Owner
Home Financials are based on the most recent Mortgage that was taken out on this home.
Original Mortgage
$361,000
Outstanding Balance
$245,810
Interest Rate
3.99%
Estimated Equity
$466,425
Purchase Details
Closed on
Aug 15, 2007
Sold by
Highland Homes Ltd
Bought by
Jacobs Alex and Jacobs Courtney
Home Financials for this Owner
Home Financials are based on the most recent Mortgage that was taken out on this home.
Original Mortgage
$296,355
Interest Rate
6.64%
Purchase Details
Closed on
Jan 10, 2007
Sold by
Frisco Northridge Ltd
Bought by
Highland Homes Ltd
Home Financials for this Owner
Home Financials are based on the most recent Mortgage that was taken out on this home.
Original Mortgage
$280,500
Interest Rate
6.09%
Mortgage Type
Purchase Money Mortgage
Create a Home Valuation Report for This Property
The Home Valuation Report is an in-depth analysis detailing your home's value as well as a comparison with similar homes in the area
Home Values in the Area
Average Home Value in this Area
Purchase History
| Date | Buyer | Sale Price | Title Company |
|---|---|---|---|
| Martinez Joseph Diego | -- | Lawyers Title | |
| Jacobs Alex | -- | Laatc | |
| Highland Homes Ltd | -- | Rtc |
Source: Public Records
Mortgage History
| Date | Status | Borrower | Loan Amount |
|---|---|---|---|
| Open | Martinez Joseph Diego | $361,000 | |
| Previous Owner | Jacobs Alex | $296,355 | |
| Previous Owner | Highland Homes Ltd | $280,500 |
Source: Public Records
Tax History Compared to Growth
Tax History
| Year | Tax Paid | Tax Assessment Tax Assessment Total Assessment is a certain percentage of the fair market value that is determined by local assessors to be the total taxable value of land and additions on the property. | Land | Improvement |
|---|---|---|---|---|
| 2025 | -- | $675,345 | $175,000 | $500,345 |
| 2024 | -- | $648,282 | $175,000 | $571,357 |
| 2023 | $9,962 | $589,347 | $175,000 | $552,797 |
| 2022 | $0 | $535,770 | $150,000 | $470,236 |
| 2021 | $0 | $487,064 | $110,000 | $377,064 |
| 2020 | $9,249 | $453,150 | $95,000 | $358,150 |
| 2019 | $9,822 | $457,130 | $95,000 | $362,130 |
| 2018 | $9,942 | $456,328 | $95,000 | $362,544 |
| 2017 | $9,038 | $414,844 | $90,000 | $324,844 |
| 2016 | $8,502 | $399,344 | $90,000 | $309,344 |
| 2015 | -- | $351,368 | $90,000 | $261,368 |
Source: Public Records
Map
Nearby Homes
- 5969 Franklin Ct
- 5772 Noble Oak Ln
- 5766 Wellington Ln
- 5770 Haverhill Ln
- 5772 Franklin Ct
- 5949 Stanton Place
- 5946 Wallis Dr
- 5014 Toledo Bend Dr
- 5007 Linda Ln
- 12295 Sunny St
- 12502 Harvest Meadow Dr
- 7220 Panicum Dr
- 12530 Harvest Meadow Dr
- 7297 Sacaton Trail
- 12277 Farmstead Dr
- 13162 Riverhill Rd
- 4398 Corn Husk Dr
- 4384 Corn Husk Dr
- 4365 Corn Husk Dr
- 7411 Joshua Rd
- 5913 Haverhill Ln
- 5961 Haverhill Ln
- 5868 Noble Oak Ln
- 5899 Haverhill Ln
- 5850 Noble Oak Ln
- 5886 Noble Oak Ln
- 5946 Haverhill Ln
- 5920 Haverhill Ln
- 5972 Haverhill Ln
- 5832 Noble Oak Ln
- 5845 Haverhill Ln
- 13046 Belle Isle Ln
- 13028 Belle Isle Ln
- 5814 Noble Oak Ln
- 5998 Haverhill Ln
- 5878 Haverhill Ln
- 13064 Belle Isle Ln
- 13082 Belle Isle Ln
- 13010 Belle Isle Ln
- 5839 Noble Oak Ln