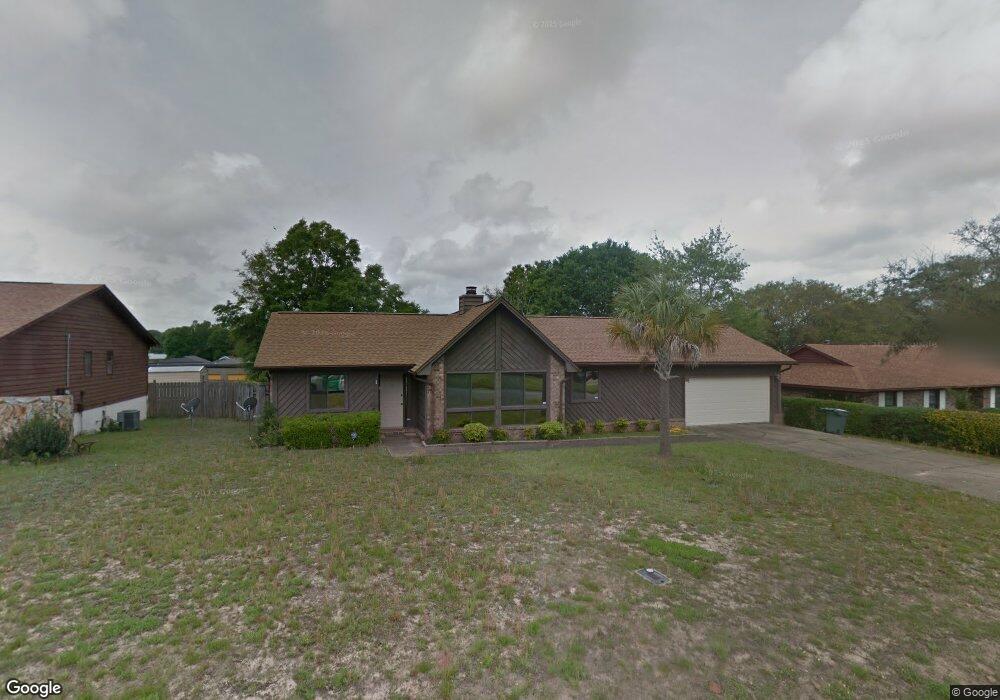
5937 Roble Loma Dr Pensacola, FL 32526
Estimated Value: $233,000 - $276,000
--
Bed
2
Baths
1,643
Sq Ft
$152/Sq Ft
Est. Value
About This Home
This home is located at 5937 Roble Loma Dr, Pensacola, FL 32526 and is currently estimated at $250,417, approximately $152 per square foot. 5937 Roble Loma Dr is a home located in Escambia County with nearby schools including Bellview Elementary School, Bellview Middle School, and Pine Forest High School.
Ownership History
Date
Name
Owned For
Owner Type
Purchase Details
Closed on
Mar 3, 2022
Sold by
Hall John L
Bought by
Hall John L and Suarez Aaron F
Current Estimated Value
Home Financials for this Owner
Home Financials are based on the most recent Mortgage that was taken out on this home.
Original Mortgage
$93,000
Outstanding Balance
$75,049
Interest Rate
3.15%
Mortgage Type
Balloon
Estimated Equity
$175,368
Purchase Details
Closed on
Aug 25, 2005
Sold by
Patterson Wyatt C
Bought by
Hall John L
Home Financials for this Owner
Home Financials are based on the most recent Mortgage that was taken out on this home.
Original Mortgage
$123,600
Interest Rate
5.64%
Mortgage Type
Fannie Mae Freddie Mac
Purchase Details
Closed on
Nov 20, 2001
Sold by
Hazel Deborah C and Hazel Gary A
Bought by
Patterson Wyatt C and Patterson Diane W
Home Financials for this Owner
Home Financials are based on the most recent Mortgage that was taken out on this home.
Original Mortgage
$88,117
Interest Rate
6.54%
Mortgage Type
FHA
Create a Home Valuation Report for This Property
The Home Valuation Report is an in-depth analysis detailing your home's value as well as a comparison with similar homes in the area
Home Values in the Area
Average Home Value in this Area
Purchase History
| Date | Buyer | Sale Price | Title Company |
|---|---|---|---|
| Hall John L | -- | Boston National Title Agency | |
| Hall John L | $154,500 | Esquire Title Research Inc | |
| Patterson Wyatt C | $89,500 | -- |
Source: Public Records
Mortgage History
| Date | Status | Borrower | Loan Amount |
|---|---|---|---|
| Open | Hall John L | $93,000 | |
| Previous Owner | Hall John L | $123,600 | |
| Previous Owner | Patterson Wyatt C | $88,117 |
Source: Public Records
Tax History Compared to Growth
Tax History
| Year | Tax Paid | Tax Assessment Tax Assessment Total Assessment is a certain percentage of the fair market value that is determined by local assessors to be the total taxable value of land and additions on the property. | Land | Improvement |
|---|---|---|---|---|
| 2024 | $975 | $107,472 | -- | -- |
| 2023 | $975 | $104,342 | $0 | $0 |
| 2022 | $945 | $101,303 | $0 | $0 |
| 2021 | $936 | $98,353 | $0 | $0 |
| 2020 | $914 | $96,996 | $0 | $0 |
| 2019 | $892 | $94,816 | $0 | $0 |
| 2018 | $887 | $93,049 | $0 | $0 |
| 2017 | $880 | $91,136 | $0 | $0 |
| 2016 | $869 | $89,262 | $0 | $0 |
| 2015 | $850 | $88,642 | $0 | $0 |
| 2014 | $838 | $87,939 | $0 | $0 |
Source: Public Records
Map
Nearby Homes
- 5814 Roble Loma Dr
- 2400 BLK Michigan Ave
- 3028 Brigantine Dr
- 5496 Wales Ave
- 2004 Rowe Ln
- 9663 Angel Oak Dr
- 9632 Angel Oak Dr
- 2310 Buckingham Rd
- 6110 Nashville Ave
- 2600 W Michigan Ave Unit B82
- 6214 Montgomery Ave
- 6209 Dallas Ave
- 6211 Dallas Ave
- 7036 Rampart Way
- 220 Sand Trap Ln
- 2004 Pin High Dr
- 5650 Talquin Ave
- 2016 Pin High Dr
- 2654 Tinosa Cir Unit 3
- 6173 Native Dancer Way
- 5941 Roble Loma Dr
- 5933 Roble Loma Dr
- 5929 Roble Loma Dr
- 5945 Roble Loma Dr
- 5936 Roble Loma Dr
- 5932 Roble Loma Dr
- 5946 Roble Loma Dr
- 5928 Roble Loma Dr
- 0 Roble Loma Dr
- 5949 Roble Loma Dr
- 5924 Roble Loma Dr
- 5953 Roble Loma Dr
- 5815 Roble Loma Dr
- 5819 Roble Loma Dr
- 5807 Roble Loma Dr
- 5800 Roble Loma Dr
- 5921 Roble Loma Dr Unit 5921 ROBLE LOMA DR
- 5823 Roble Loma Dr
- 5906 Bilek Dr
- 5902 Bilek Dr