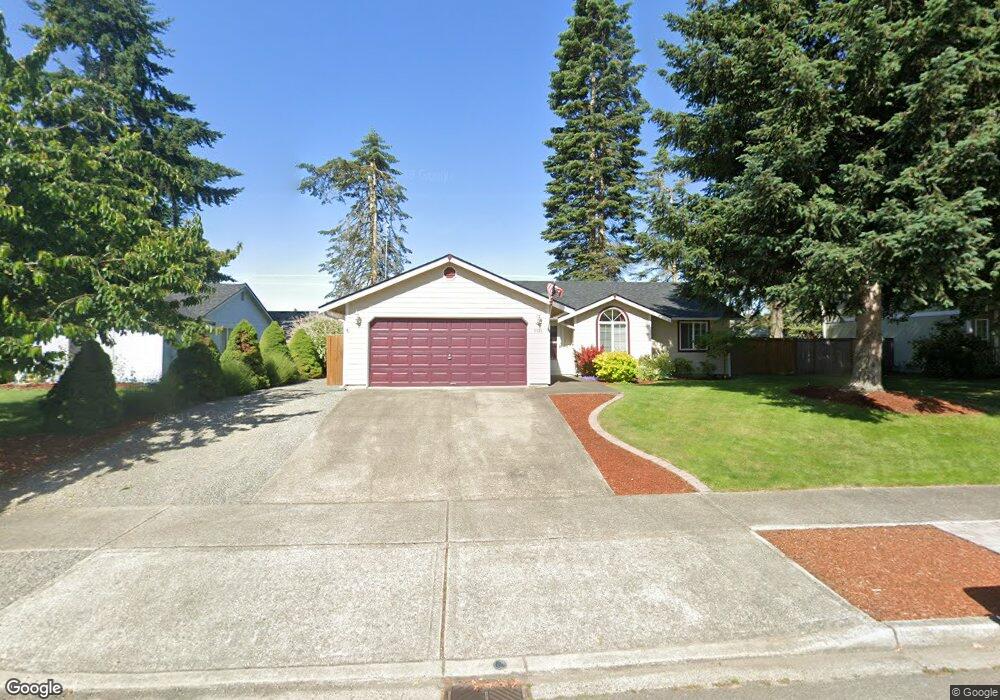
5938 Cherokee Loop SE Lacey, WA 98513
Lakepointe NeighborhoodEstimated Value: $445,000 - $467,000
3
Beds
2
Baths
1,336
Sq Ft
$340/Sq Ft
Est. Value
About This Home
This home is located at 5938 Cherokee Loop SE, Lacey, WA 98513 and is currently estimated at $454,839, approximately $340 per square foot. 5938 Cherokee Loop SE is a home located in Thurston County with nearby schools including Lakes Elementary School, Komachin Middle School, and Timberline High School.
Ownership History
Date
Name
Owned For
Owner Type
Purchase Details
Closed on
Dec 14, 2011
Sold by
Deutsche Bank National Trust
Bought by
Rogers Stanley and Rogers Carol
Current Estimated Value
Home Financials for this Owner
Home Financials are based on the most recent Mortgage that was taken out on this home.
Original Mortgage
$54,700
Outstanding Balance
$34,989
Interest Rate
3%
Mortgage Type
New Conventional
Estimated Equity
$419,850
Purchase Details
Closed on
Oct 18, 2010
Sold by
Blue Denise C
Bought by
Deutsche Bank National Trust Company
Purchase Details
Closed on
Sep 2, 1999
Sold by
Medick Anthony K and Medick Sherry J
Bought by
Blue Denise C
Home Financials for this Owner
Home Financials are based on the most recent Mortgage that was taken out on this home.
Original Mortgage
$91,200
Interest Rate
10.5%
Create a Home Valuation Report for This Property
The Home Valuation Report is an in-depth analysis detailing your home's value as well as a comparison with similar homes in the area
Home Values in the Area
Average Home Value in this Area
Purchase History
| Date | Buyer | Sale Price | Title Company |
|---|---|---|---|
| Rogers Stanley | $133,500 | First American Title | |
| Deutsche Bank National Trust Company | $169,200 | None Available | |
| Blue Denise C | $113,988 | First American Title Ins Co |
Source: Public Records
Mortgage History
| Date | Status | Borrower | Loan Amount |
|---|---|---|---|
| Open | Rogers Stanley | $54,700 | |
| Previous Owner | Blue Denise C | $91,200 | |
| Closed | Blue Denise C | $18,192 |
Source: Public Records
Tax History
| Year | Tax Paid | Tax Assessment Tax Assessment Total Assessment is a certain percentage of the fair market value that is determined by local assessors to be the total taxable value of land and additions on the property. | Land | Improvement |
|---|---|---|---|---|
| 2025 | $3,610 | $408,400 | $142,800 | $265,600 |
| 2024 | $3,610 | $395,900 | $137,200 | $258,700 |
| 2023 | $3,610 | $373,300 | $117,600 | $255,700 |
| 2022 | $3,433 | $364,000 | $80,700 | $283,300 |
| 2021 | $3,077 | $294,900 | $85,400 | $209,500 |
| 2020 | $2,737 | $246,200 | $82,100 | $164,100 |
| 2019 | $2,259 | $227,400 | $69,300 | $158,100 |
| 2018 | $2,478 | $184,500 | $54,800 | $129,700 |
| 2017 | $2,278 | $178,550 | $51,250 | $127,300 |
| 2016 | $2,118 | $165,150 | $47,550 | $117,600 |
| 2014 | -- | $161,850 | $47,550 | $114,300 |
Source: Public Records
Map
Nearby Homes
- 6733 Steamer Dr SE
- 6512 Steamer Dr SE
- 5579 Foxglove Ct SE
- 6301 Stockton Ln SE Unit 6
- 6301 Stockton Ln SE Unit 2
- 5479 Rumac St SE
- 6317 Barstow Ln SE Unit 8
- 5603 James St SE
- 6068 Illinois Ln SE Unit A
- 5218 Pattison Lake Ln SE
- 5117 Rumac St SE
- 6026 57th Ave SE
- 6036 55th Ct SE
- 6029 54th Ct SE
- 6246 Wade Ct SE
- 6509 Oklahoma St SE
- 6520 Indiana St SE
- 5933 55th Way SE
- 7349 Fair Oaks Rd SE
- 6531 Indiana St SE
- 5936 Cherokee Loop SE
- 5942 Cherokee Loop SE
- 5904 Cherokee Loop SE
- 5906 Cherokee Loop SE
- 5902 Cherokee Loop SE
- 5934 Cherokee Loop SE
- 5946 Cherokee Loop SE
- 5939 Cherokee Loop SE
- 5937 Cherokee Loop SE
- 5941 Cherokee Loop SE
- 5900 Cherokee Loop SE
- 5935 Cherokee Loop SE
- 5932 Cherokee Loop SE
- 5945 Cherokee Loop SE
- 5910 Cherokee Loop SE
- 5933 Cherokee Loop SE
- 5905 Danials Loop SE
- 5905 Cherokee Loop SE
- 5907 Danials Loop SE
Your Personal Tour Guide
Ask me questions while you tour the home.