Estimated Value: $941,000 - $1,384,830
4
Beds
4
Baths
3,760
Sq Ft
$331/Sq Ft
Est. Value
About This Home
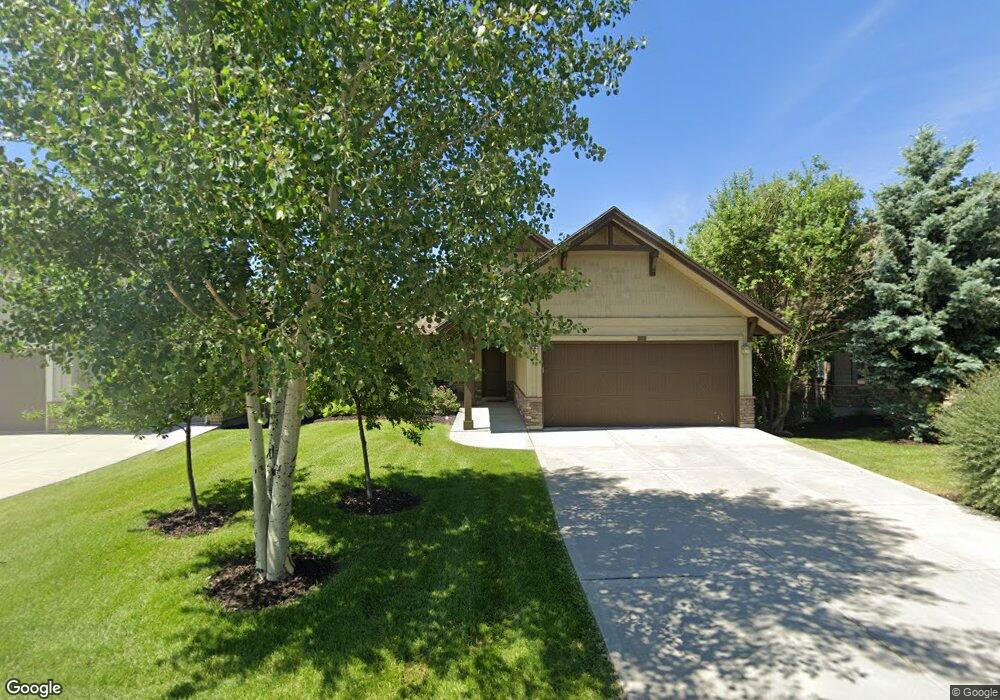
This home is located at 5938 E Big Horn Pkwy Unit 128, Eden, UT 84310 and is currently estimated at $1,244,458, approximately $330 per square foot. 5938 E Big Horn Pkwy Unit 128 is a home located in Weber County with nearby schools including Valley Elementary School, Snowcrest Junior High School, and Weber High School.
Ownership History
Date
Name
Owned For
Owner Type
Purchase Details
Closed on
Mar 27, 2023
Sold by
Strong Dan E
Bought by
Strong Living Trust
Current Estimated Value
Purchase Details
Closed on
Mar 24, 2020
Sold by
Adams David L and Adams Janis E
Bought by
Strong Dan E
Purchase Details
Closed on
Apr 3, 2018
Sold by
Lloy Thomas S and Lloy Dianne
Bought by
Adams David L and Adams Janis E
Purchase Details
Closed on
Feb 15, 2017
Sold by
Lloy Thomas S and Lloy Dianne
Bought by
Lloy Thomas S and Lloy Dianne
Purchase Details
Closed on
Oct 27, 2006
Sold by
Eden Village Llc
Bought by
Adams David L
Home Financials for this Owner
Home Financials are based on the most recent Mortgage that was taken out on this home.
Original Mortgage
$520,000
Interest Rate
6.3%
Mortgage Type
Construction
Create a Home Valuation Report for This Property
The Home Valuation Report is an in-depth analysis detailing your home's value as well as a comparison with similar homes in the area
Home Values in the Area
Average Home Value in this Area
Purchase History
| Date | Buyer | Sale Price | Title Company |
|---|---|---|---|
| Strong Living Trust | -- | None Listed On Document | |
| Strong Dan E | -- | Metro National Title | |
| Adams David L | -- | Metro National Title | |
| Lloy Thomas S | -- | None Available | |
| Adams David L | -- | Metro National Title Ogden |
Source: Public Records
Mortgage History
| Date | Status | Borrower | Loan Amount |
|---|---|---|---|
| Previous Owner | Adams David L | $520,000 |
Source: Public Records
Tax History Compared to Growth
Tax History
| Year | Tax Paid | Tax Assessment Tax Assessment Total Assessment is a certain percentage of the fair market value that is determined by local assessors to be the total taxable value of land and additions on the property. | Land | Improvement |
|---|---|---|---|---|
| 2025 | $10,965 | $1,231,950 | $300,000 | $931,950 |
| 2024 | $10,965 | $1,155,000 | $300,000 | $855,000 |
| 2023 | $11,694 | $1,216,131 | $300,000 | $916,131 |
| 2022 | $9,806 | $1,038,428 | $250,000 | $788,428 |
| 2021 | $7,336 | $720,020 | $170,000 | $550,020 |
| 2020 | $6,337 | $570,993 | $130,000 | $440,993 |
| 2019 | $6,449 | $556,188 | $112,969 | $443,219 |
| 2018 | $6,668 | $551,776 | $110,385 | $441,391 |
| 2017 | $5,955 | $483,523 | $99,966 | $383,557 |
| 2016 | $5,980 | $479,259 | $74,900 | $404,359 |
| 2015 | $5,393 | $427,410 | $55,028 | $372,382 |
| 2014 | $5,819 | $451,135 | $55,028 | $396,107 |
Source: Public Records
Map
Nearby Homes
- 5937 E Big Horn Pkwy
- 5951 E Big Horn Pkwy
- 5882 E Big Horn Pkwy Unit 501
- 5985 E Big Horn Pkwy Unit 137
- 3435 Big Piney Dr
- 5713 E Elkhorn Dr
- 6042 E Big Horn Pkwy
- 3438 N Trappers Ct
- 5654 E Elkhorn Dr Unit 69
- 5448 Wapiti Cir Unit 38
- 3577 N Elkridge Trail
- 5731 E Porcupine Ridge Dr
- 3545 N Elkridge Trail Unit 48
- 3717 N Red Hawk Cir Unit 21
- 4032 Elk Ridge Trail Unit 109
- 3639 N Middle Fork Rd Unit 118
- 5652 E Porcupine Ridge Dr
- 5786 N Porcupine Ridge Dr E Unit 91
- 5235 E Moose Hollow Dr Unit 402
- 3453 N 5250 E
- 5938 E Big Horn Pkwy
- 5932 E Big Horn Pkwy Unit 129
- 5932 E Big Horn Pkwy
- 5942 E Big Horn Pkwy
- 5942 E Big Horn Pkwy Unit 127
- 5948 E Big Horn Pkwy Unit 126
- 5937 E Big Horn Pkwy Unit 114
- 5937 E Big Horn Pkwy Unit 606
- 5931 E Big Horn Pkwy Unit 113
- 5952 E Big Horn Pkwy
- 5951 E Big Horn Pkwy Unit 116
- 5923 E Big Horn Pkwy
- 5923 E Big Horn Pkwy Unit 112
- 5956 E Big Horn Pkwy Unit 124
- 5917 E Big Horn Pkwy
- 5917 E Big Horn Pkwy Unit 111
- 5950 E Big Horn Pkwy
- 5963 E Big Horn Pkwy
- 3379 N Windriver Ct
- 3379 N Windriver Ct Unit TR57