Estimated Value: $187,176 - $245,000
3
Beds
2
Baths
1,419
Sq Ft
$158/Sq Ft
Est. Value
About This Home
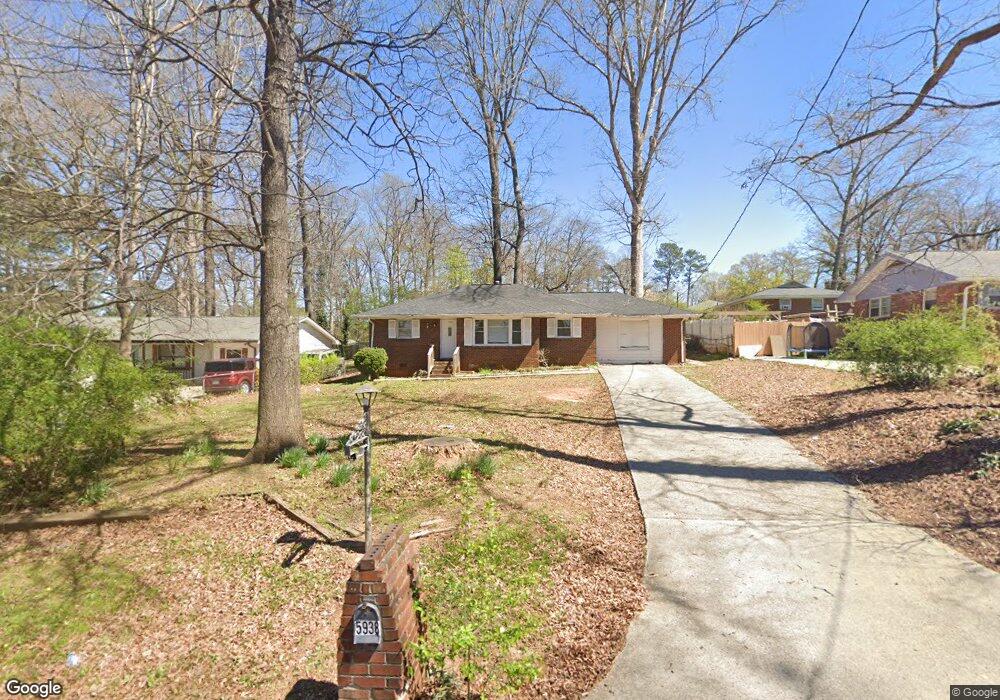
This home is located at 5938 Meadowview Rd, Rex, GA 30273 and is currently estimated at $223,794, approximately $157 per square foot. 5938 Meadowview Rd is a home located in Clayton County with nearby schools including East Clayton Elementary School, Adamson Middle School, and Morrow High School.
Ownership History
Date
Name
Owned For
Owner Type
Purchase Details
Closed on
Apr 25, 2005
Sold by
Miller William A
Bought by
Macmor Properties Llc
Current Estimated Value
Purchase Details
Closed on
Aug 30, 2004
Sold by
Private Equity Inc
Bought by
Miller William A
Purchase Details
Closed on
Apr 6, 2004
Sold by
Mcclure Vance H and Mcclure Debbie J
Bought by
Private Equity Inc
Purchase Details
Closed on
Jun 28, 1996
Sold by
Ferguson Thomas S Christina
Bought by
Mcclure Vance H Debbie J
Create a Home Valuation Report for This Property
The Home Valuation Report is an in-depth analysis detailing your home's value as well as a comparison with similar homes in the area
Home Values in the Area
Average Home Value in this Area
Purchase History
| Date | Buyer | Sale Price | Title Company |
|---|---|---|---|
| Macmor Properties Llc | -- | -- | |
| Miller William A | $20,000 | -- | |
| Private Equity Inc | $70,505 | -- | |
| Mcclure Vance H Debbie J | $65,500 | -- |
Source: Public Records
Tax History
| Year | Tax Paid | Tax Assessment Tax Assessment Total Assessment is a certain percentage of the fair market value that is determined by local assessors to be the total taxable value of land and additions on the property. | Land | Improvement |
|---|---|---|---|---|
| 2025 | $2,163 | $55,560 | $7,200 | $48,360 |
| 2024 | $1,703 | $42,760 | $7,200 | $35,560 |
| 2023 | $1,349 | $37,360 | $7,200 | $30,160 |
| 2022 | $1,440 | $35,800 | $7,200 | $28,600 |
| 2021 | $1,441 | $35,600 | $7,200 | $28,400 |
| 2020 | $1,351 | $32,892 | $7,200 | $25,692 |
| 2019 | $1,251 | $29,956 | $7,200 | $22,756 |
| 2018 | $1,102 | $26,282 | $7,200 | $19,082 |
| 2017 | $1,030 | $24,462 | $7,200 | $17,262 |
| 2016 | $1,043 | $24,782 | $7,200 | $17,582 |
| 2015 | $1,039 | $0 | $0 | $0 |
| 2014 | $1,005 | $24,393 | $7,200 | $17,193 |
Source: Public Records
Map
Nearby Homes
- 3548 Meadowview Ct
- 5952 Meadow Ln
- 5953 Farmbrook Ln Unit 1
- 5798 Creekside Dr Unit 4
- 5806 Waggoner Ct
- 5861 Colonnade Dr
- 3668 Paddington Trail
- 5781 Creekside Dr
- 6103 Chaseland Dr
- 6103 Chaseland Rd
- 3684 Paddington Trail
- 5914 Waggoner Ct
- 3709 Charlotte Dr
- 3645 Fay Dr Unit 1
- 5824 Rex Mill Dr Unit 3
- 3836 Rex Cir
- 3821 Rex Mill Square
- 5954 Rex Ridge Ct
- 5678 Washakie Point
- 3669 Arminto Dr
- 5920 Meadowview Rd
- 5920 Meadowview Rd Unit 7
- 5930 Meadowview Rd
- 5946 Meadowview Rd
- 3546 Lakeview Dr
- 5922 Meadowview Rd
- 3552 Lakeview Dr
- 5935 Meadowview Rd
- 5943 Meadowview Rd
- 5927 Meadowview Rd
- 3551 Meadowview Ct
- 3543 Meadowview Ct
- 5962 Meadowview Rd
- 5949 Meadowview Rd
- 5910 Meadowview Rd
- 3556 Lakeview Dr
- 5919 Meadowview Rd
- 3547 Lakeview Dr
- 5955 Meadowview Rd
- 5911 Meadowview Rd
Your Personal Tour Guide
Ask me questions while you tour the home.