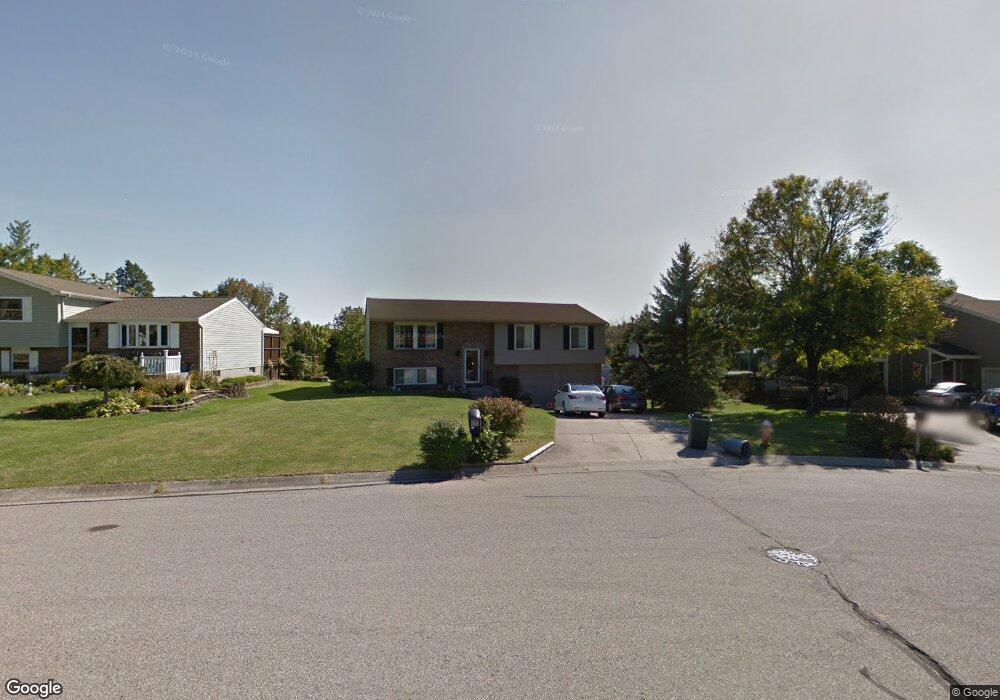
5939 Cedaridge Dr Cincinnati, OH 45247
Estimated Value: $286,000 - $305,000
3
Beds
3
Baths
1,920
Sq Ft
$155/Sq Ft
Est. Value
About This Home
This home is located at 5939 Cedaridge Dr, Cincinnati, OH 45247 and is currently estimated at $297,811, approximately $155 per square foot. 5939 Cedaridge Dr is a home located in Hamilton County with nearby schools including Charles W Springmyer Elementary School, Bridgetown Middle School, and Oak Hills High School.
Ownership History
Date
Name
Owned For
Owner Type
Purchase Details
Closed on
Nov 10, 2012
Sold by
Lauders Joseph L
Bought by
Lauders Tina and Leistner Tina
Current Estimated Value
Purchase Details
Closed on
Jun 5, 2003
Sold by
Leistner Kevin R
Bought by
Leistner Tina
Purchase Details
Closed on
Mar 22, 2002
Sold by
Brinck William E
Bought by
Leistner Kevin R and Leistner Tina
Home Financials for this Owner
Home Financials are based on the most recent Mortgage that was taken out on this home.
Original Mortgage
$115,600
Outstanding Balance
$45,084
Interest Rate
6.12%
Estimated Equity
$252,727
Purchase Details
Closed on
Jul 13, 1998
Sold by
Brinck Jeanette M
Bought by
Brinck William E
Home Financials for this Owner
Home Financials are based on the most recent Mortgage that was taken out on this home.
Original Mortgage
$7,000
Interest Rate
7.13%
Mortgage Type
Seller Take Back
Create a Home Valuation Report for This Property
The Home Valuation Report is an in-depth analysis detailing your home's value as well as a comparison with similar homes in the area
Home Values in the Area
Average Home Value in this Area
Purchase History
| Date | Buyer | Sale Price | Title Company |
|---|---|---|---|
| Lauders Tina | -- | Attorney | |
| Leistner Tina | -- | -- | |
| Leistner Kevin R | $144,500 | -- | |
| Brinck William E | -- | -- |
Source: Public Records
Mortgage History
| Date | Status | Borrower | Loan Amount |
|---|---|---|---|
| Open | Leistner Kevin R | $115,600 | |
| Closed | Brinck William E | $7,000 |
Source: Public Records
Tax History Compared to Growth
Tax History
| Year | Tax Paid | Tax Assessment Tax Assessment Total Assessment is a certain percentage of the fair market value that is determined by local assessors to be the total taxable value of land and additions on the property. | Land | Improvement |
|---|---|---|---|---|
| 2024 | $3,447 | $77,896 | $15,330 | $62,566 |
| 2023 | $3,492 | $77,896 | $15,330 | $62,566 |
| 2022 | $3,078 | $60,081 | $14,700 | $45,381 |
| 2021 | $2,754 | $60,081 | $14,700 | $45,381 |
| 2020 | $2,802 | $60,081 | $14,700 | $45,381 |
| 2019 | $2,471 | $50,068 | $12,250 | $37,818 |
| 2018 | $2,475 | $50,068 | $12,250 | $37,818 |
| 2017 | $2,327 | $50,068 | $12,250 | $37,818 |
| 2016 | $2,631 | $55,511 | $14,088 | $41,423 |
| 2015 | $2,661 | $55,511 | $14,088 | $41,423 |
| 2014 | $2,665 | $55,511 | $14,088 | $41,423 |
| 2013 | $2,106 | $48,269 | $12,250 | $36,019 |
Source: Public Records
Map
Nearby Homes
- 5509 Bluepine Dr
- 5368 Lakefront Dr
- 5237 Clearlake Dr Unit 22
- 5479 Haft Rd
- 5354 Belclare Rd
- 6044 Eden Roc Place
- 5145 Valley Ridge Rd
- 5156 Valley Ridge Rd
- 5423 Bluesky Dr
- 5105 Valley Ridge Rd
- 5819 Gaines Rd
- 5984 W Fork Rd
- 6130 W Fork Rd
- 5980 Brierly Creek Rd
- 6303 W Fork Rd
- 5998 Brierly Ridge Dr
- 5991 Gaines Rd
- 6306 W Fork Rd
- 5944 Harrison Ave
- 4921 N Arbor Woods Ct
- 5933 Cedaridge Dr
- 5945 Cedaridge Dr
- 5927 Cedaridge Dr
- 5948 Cedaridge Dr
- 5936 Cedaridge Dr
- 5942 Cedaridge Dr
- 5930 Cedaridge Dr
- 5921 Cedaridge Dr
- 5924 Cedaridge Dr
- 5915 Cedaridge Dr
- 5918 Cedaridge Dr
- 5415 Douglas Fir Ct
- 5421 Douglas Fir Ct
- 5427 Douglas Fir Ct
- 5912 Cedaridge Dr
- 5409 Douglas Fir Ct
- 5909 Cedaridge Dr
- 5437 Douglas Fir Ct
- 5403 Douglas Fir Ct
- 5906 Cedaridge Dr