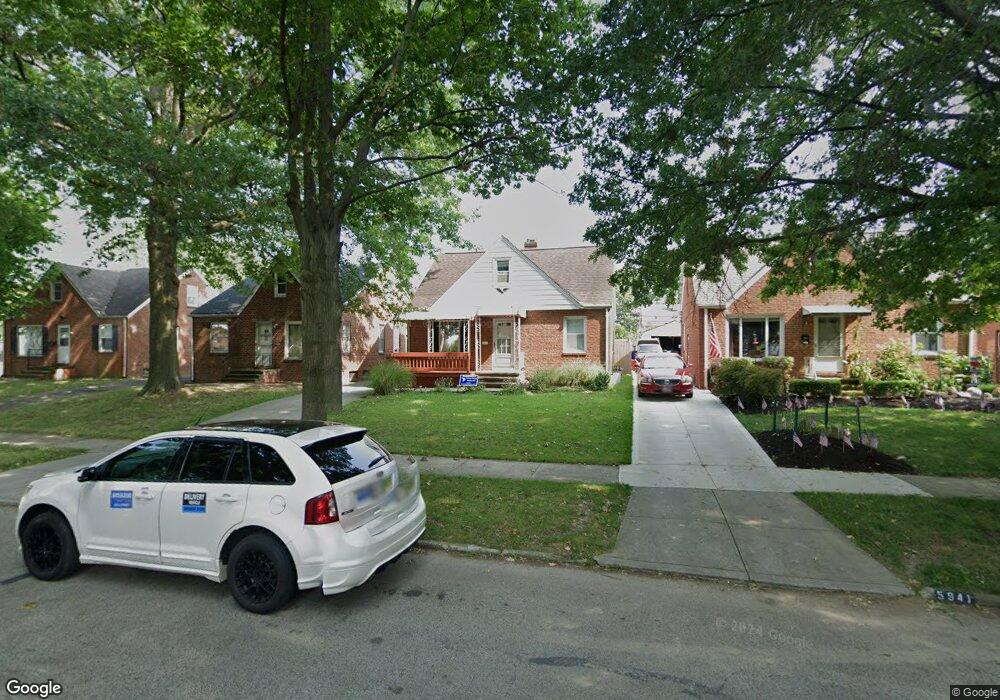
5939 Hodgeman Dr Parma Heights, OH 44130
Estimated Value: $215,000 - $241,000
3
Beds
2
Baths
1,174
Sq Ft
$192/Sq Ft
Est. Value
About This Home
This home is located at 5939 Hodgeman Dr, Parma Heights, OH 44130 and is currently estimated at $224,827, approximately $191 per square foot. 5939 Hodgeman Dr is a home located in Cuyahoga County with nearby schools including Renwood Elementary School, Greenbriar Middle School, and Valley Forge High School.
Ownership History
Date
Name
Owned For
Owner Type
Purchase Details
Closed on
Jul 7, 2023
Sold by
Orengo Jose L
Bought by
Th Property Owner I Llc
Current Estimated Value
Purchase Details
Closed on
Jul 22, 2020
Sold by
Tanski Kevin
Bought by
Orengo Jose L
Home Financials for this Owner
Home Financials are based on the most recent Mortgage that was taken out on this home.
Original Mortgage
$122,573
Interest Rate
3.2%
Mortgage Type
FHA
Purchase Details
Closed on
Sep 17, 2003
Sold by
Shroka Myrna J
Bought by
Tanski Kevin
Purchase Details
Closed on
Sep 12, 2002
Sold by
Shroka Myrna J
Bought by
Shroka Myrna J
Purchase Details
Closed on
Dec 9, 1993
Sold by
Shroka William J
Bought by
Shroka Myrna J
Purchase Details
Closed on
Sep 14, 1982
Sold by
Shroka William J and Shroka Myrna J
Bought by
Shroka William J
Purchase Details
Closed on
Jan 1, 1975
Bought by
Shroka William J and Shroka Myrna J
Create a Home Valuation Report for This Property
The Home Valuation Report is an in-depth analysis detailing your home's value as well as a comparison with similar homes in the area
Home Values in the Area
Average Home Value in this Area
Purchase History
| Date | Buyer | Sale Price | Title Company |
|---|---|---|---|
| Th Property Owner I Llc | $185,000 | None Listed On Document | |
| Orengo Jose L | $133,850 | City Title Company | |
| Tanski Kevin | $129,000 | Multiple | |
| Shroka Myrna J | -- | -- | |
| Shroka Myrna J | -- | -- | |
| Shroka William J | -- | -- | |
| Shroka William J | -- | -- |
Source: Public Records
Mortgage History
| Date | Status | Borrower | Loan Amount |
|---|---|---|---|
| Previous Owner | Orengo Jose L | $122,573 |
Source: Public Records
Tax History Compared to Growth
Tax History
| Year | Tax Paid | Tax Assessment Tax Assessment Total Assessment is a certain percentage of the fair market value that is determined by local assessors to be the total taxable value of land and additions on the property. | Land | Improvement |
|---|---|---|---|---|
| 2024 | $3,578 | $54,390 | $11,480 | $42,910 |
| 2023 | $3,002 | $40,120 | $9,770 | $30,350 |
| 2022 | $2,986 | $40,110 | $9,765 | $30,345 |
| 2021 | $2,991 | $40,110 | $9,770 | $30,350 |
| 2020 | $2,760 | $32,340 | $7,880 | $24,470 |
| 2019 | $2,688 | $92,400 | $22,500 | $69,900 |
| 2018 | $2,595 | $32,340 | $7,880 | $24,470 |
| 2017 | $2,508 | $28,110 | $5,950 | $22,160 |
| 2016 | $2,490 | $28,110 | $5,950 | $22,160 |
| 2015 | $2,572 | $28,110 | $5,950 | $22,160 |
| 2014 | $2,572 | $29,270 | $6,200 | $23,070 |
Source: Public Records
Map
Nearby Homes
- 5926 Deering Ave
- 5972 Westminster Dr
- 5906 Twin Lakes Dr
- 5860 Pearl Rd
- 5845 Lotusdale Dr
- 8514 Deerfield Dr
- 6111 Denison Blvd
- 0 Parkhill Dr Unit 5116837
- 9621 Elsmere Dr
- 10172 Keswick Dr
- 5717 Chestnut Dr
- 6108 Pearl Rd
- 7615 Bertha Ave
- 7514 Spring Garden Rd
- 7619 Snow Rd
- 7503 Whittington Dr
- 7910 Dresden Ave
- 8017 Wainstead Dr
- 5630 Onaway Oval
- 7600 Dresden Ave
- 5939 Hodgman Dr
- 5937 Hodgeman Dr
- 5941 Hodgeman Dr
- 5935 Hodgman Dr
- 5945 Hodgeman Dr
- 5935 Hodgeman Dr
- 5949 Hodgeman Dr
- 5960 Deering Ave
- 5958 Deering Ave
- 5962 Deering Ave
- 5954 Deering Ave
- 5964 Deering Ave
- 5938 Hodgman Dr
- 5968 Deering Ave
- 5931 Hodgman Dr
- 5931 Hodgeman Dr
- 5938 Hodgeman Dr
- 5942 Hodgeman Dr
- 5934 Hodgman Dr
- 5934 Hodgeman Dr