Estimated Value: $417,000 - $449,000
5
Beds
3
Baths
2,592
Sq Ft
$166/Sq Ft
Est. Value
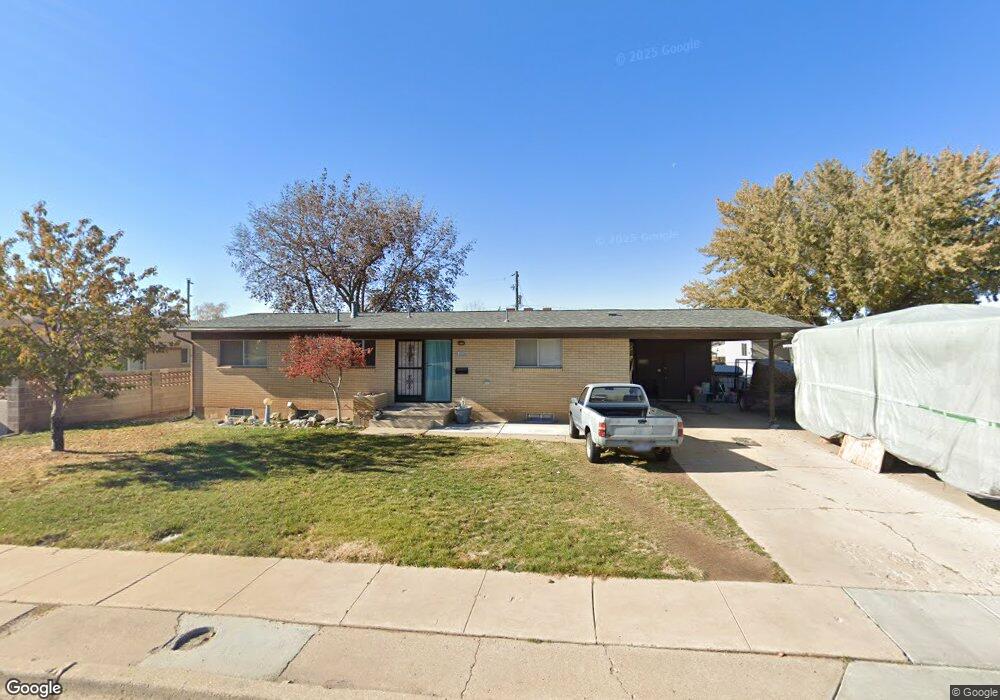
About This Home
This home is located at 5939 S 2000 W, Roy, UT 84067 and is currently estimated at $429,003, approximately $165 per square foot. 5939 S 2000 W is a home located in Weber County with nearby schools including Municipal School, Roy Junior High School, and Roy High School.
Ownership History
Date
Name
Owned For
Owner Type
Purchase Details
Closed on
Nov 7, 2013
Sold by
Sonognini Michael H and Sonognini Jennifer
Bought by
Barba Jeremy W
Current Estimated Value
Home Financials for this Owner
Home Financials are based on the most recent Mortgage that was taken out on this home.
Original Mortgage
$7,000
Outstanding Balance
$5,229
Interest Rate
4.27%
Mortgage Type
Stand Alone Second
Estimated Equity
$423,774
Purchase Details
Closed on
Nov 1, 2006
Sold by
Sonognini Jennifer
Bought by
Sonognini Michael H and Sonognini Jennifer
Home Financials for this Owner
Home Financials are based on the most recent Mortgage that was taken out on this home.
Original Mortgage
$125,000
Interest Rate
6.02%
Mortgage Type
New Conventional
Purchase Details
Closed on
Sep 10, 2004
Sold by
Carmony Kevin B
Bought by
Sonognini Michael H and Sonognini Jennifer
Create a Home Valuation Report for This Property
The Home Valuation Report is an in-depth analysis detailing your home's value as well as a comparison with similar homes in the area
Home Values in the Area
Average Home Value in this Area
Purchase History
We collect this data history from publicly available records. To have your information removed, we recommend requesting removal directly through your county’s website.
| Date | Buyer | Sale Price | Title Company |
|---|---|---|---|
| Barba Jeremy W | -- | Hickman Land Title Company | |
| Sonognini Michael H | -- | Hickman Land Title Company | |
| Sonognini Jennifer | -- | Hickman Land Title Company | |
| Sonognini Michael H | -- | Backham Stewart Title |
Source: Public Records
Mortgage History
We collect this data history from publicly available records. To have your information removed, we recommend requesting removal directly through your county’s website.
| Date | Status | Borrower | Loan Amount |
|---|---|---|---|
| Open | Barba Jeremy W | $7,000 | |
| Open | Barba Jeremy W | $147,184 | |
| Previous Owner | Sonognini Jennifer | $125,000 |
Source: Public Records
Tax History
| Year | Tax Paid | Tax Assessment Tax Assessment Total Assessment is a certain percentage of the fair market value that is determined by local assessors to be the total taxable value of land and additions on the property. | Land | Improvement |
|---|---|---|---|---|
| 2025 | $2,539 | $401,083 | $114,910 | $286,173 |
| 2024 | $2,493 | $218,349 | $63,208 | $155,141 |
| 2023 | $2,397 | $210,100 | $58,198 | $151,902 |
| 2022 | $2,374 | $213,950 | $50,793 | $163,157 |
| 2021 | $1,847 | $271,000 | $64,523 | $206,477 |
| 2020 | $1,756 | $237,000 | $64,523 | $172,477 |
| 2019 | $1,694 | $215,000 | $36,735 | $178,265 |
| 2018 | $1,566 | $186,000 | $34,870 | $151,130 |
| 2017 | $1,447 | $160,000 | $34,581 | $125,419 |
| 2016 | $1,448 | $86,544 | $16,961 | $69,583 |
| 2015 | $1,340 | $81,706 | $16,961 | $64,745 |
| 2014 | $1,351 | $81,706 | $16,961 | $64,745 |
Source: Public Records
Map
Nearby Homes
- 2033 W 5850 S
- 2090 W 5800 S
- 2632 N 140 W
- 6075 S 2125 W
- 5774 S 2200 W
- 2603 N 2080 W
- 2190 W 5700 S
- 321 W 2575 N
- 2078 W 5600 S
- 2146 W 5600 S Unit 29
- 2122 W 5600 S
- 484 W 2650 N
- 5619 S 2200 W
- 5545 S 2100 W Unit 5
- 5545 S 2100 W Unit D22
- 459 W 2575 N
- 2597 N 500 W
- 2143 W 5500 S
- 2182 W 5600 S Unit 25
- 2512 N 475 W
Your Personal Tour Guide
Ask me questions while you tour the home.