Estimated Value: $393,342 - $416,000
3
Beds
2
Baths
1,058
Sq Ft
$385/Sq Ft
Est. Value
About This Home
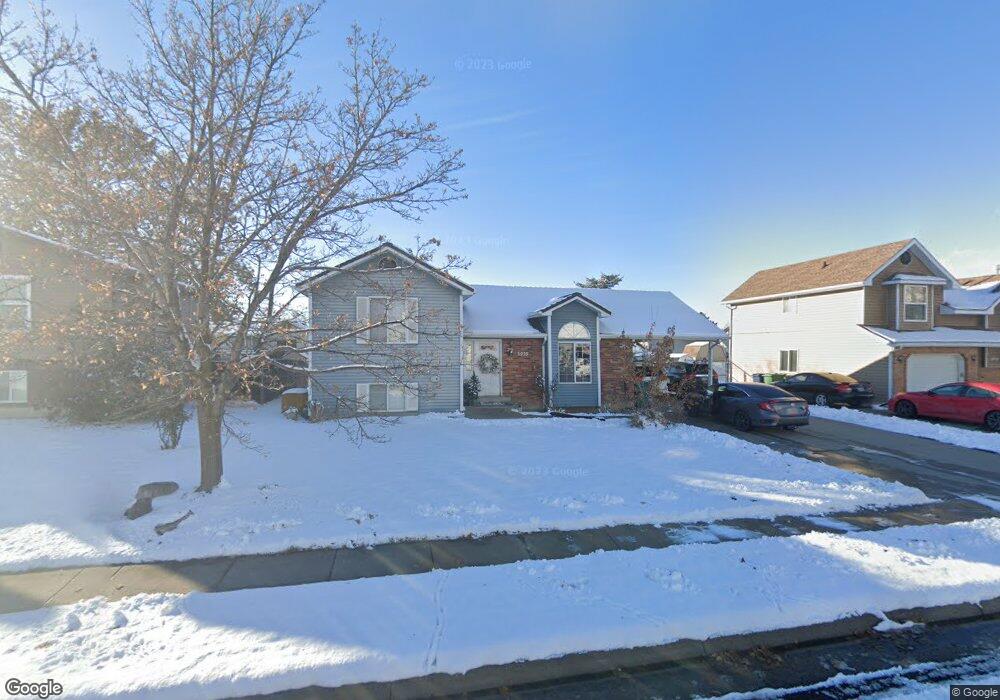
This home is located at 5939 S 3950 W, Roy, UT 84067 and is currently estimated at $406,836, approximately $384 per square foot. 5939 S 3950 W is a home located in Weber County with nearby schools including Freedom School, Roy Junior High School, and Roy High School.
Ownership History
Date
Name
Owned For
Owner Type
Purchase Details
Closed on
May 24, 2011
Sold by
Bybee Troy G and Bybee Marie K
Bought by
The Troy G & Marie K Bybee Revocable Tru and Bybee Troy G
Current Estimated Value
Home Financials for this Owner
Home Financials are based on the most recent Mortgage that was taken out on this home.
Original Mortgage
$59,800
Interest Rate
4.84%
Mortgage Type
New Conventional
Purchase Details
Closed on
Nov 14, 2002
Sold by
Bybee Troy G and Bybee Marie K
Bought by
Bybee Troy G and Bybee Marie K
Home Financials for this Owner
Home Financials are based on the most recent Mortgage that was taken out on this home.
Original Mortgage
$80,000
Interest Rate
5.95%
Purchase Details
Closed on
Sep 29, 1999
Sold by
Bybee Troy G and Bybee Marie K
Bought by
Bybee Troy G and Bybee Marie K
Create a Home Valuation Report for This Property
The Home Valuation Report is an in-depth analysis detailing your home's value as well as a comparison with similar homes in the area
Home Values in the Area
Average Home Value in this Area
Purchase History
| Date | Buyer | Sale Price | Title Company |
|---|---|---|---|
| The Troy G & Marie K Bybee Revocable Tru | -- | Hickman Land Title Company | |
| Bybee Troy G | -- | Hickman Land Title Company | |
| Bybee Troy G | -- | Bonneville Title | |
| Bybee Troy G | -- | Bonneville Title | |
| Bybee Troy G | -- | -- |
Source: Public Records
Mortgage History
| Date | Status | Borrower | Loan Amount |
|---|---|---|---|
| Closed | Bybee Troy G | $59,800 | |
| Closed | Bybee Troy G | $80,000 |
Source: Public Records
Tax History Compared to Growth
Tax History
| Year | Tax Paid | Tax Assessment Tax Assessment Total Assessment is a certain percentage of the fair market value that is determined by local assessors to be the total taxable value of land and additions on the property. | Land | Improvement |
|---|---|---|---|---|
| 2025 | $2,095 | $371,186 | $135,000 | $236,186 |
| 2024 | $2,028 | $199,099 | $74,257 | $124,842 |
| 2023 | $2,002 | $196,900 | $65,968 | $130,932 |
| 2022 | $2,229 | $223,300 | $60,501 | $162,799 |
| 2021 | $1,673 | $278,000 | $80,017 | $197,983 |
| 2020 | $1,583 | $241,000 | $80,017 | $160,983 |
| 2019 | $1,600 | $230,000 | $45,048 | $184,952 |
| 2018 | $1,457 | $198,000 | $39,924 | $158,076 |
| 2017 | $1,350 | $173,000 | $39,924 | $133,076 |
| 2016 | $1,245 | $85,986 | $21,415 | $64,571 |
| 2015 | $1,041 | $74,165 | $21,415 | $52,750 |
| 2014 | $1,004 | $70,756 | $18,611 | $52,145 |
Source: Public Records
Map
Nearby Homes