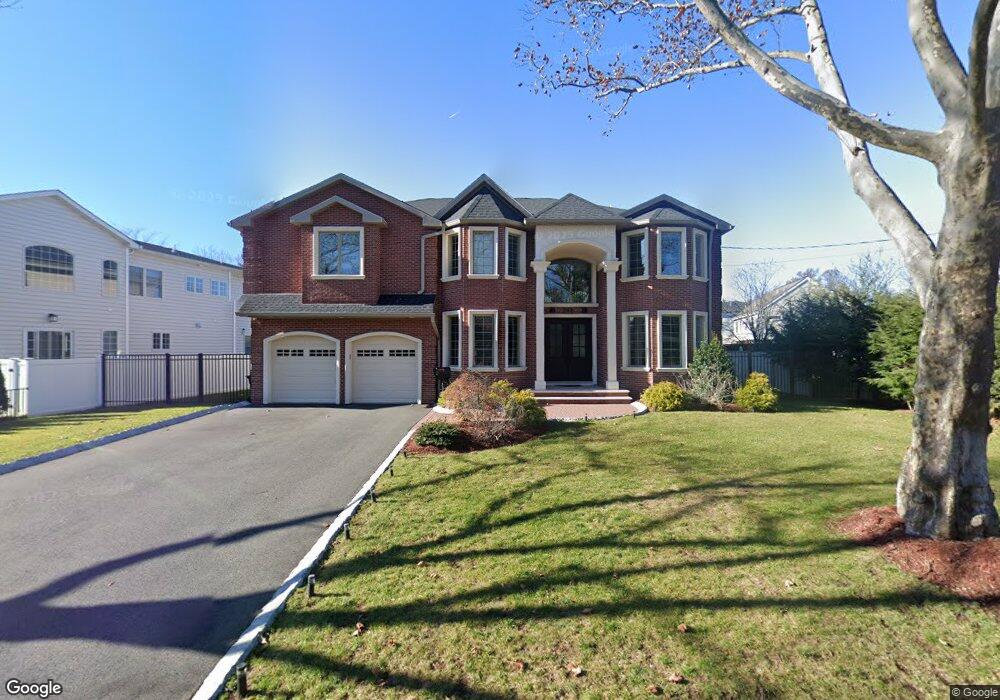
594 Craig Ave Paramus, NJ 07652
Estimated Value: $1,793,000 - $1,925,895
5
Beds
5
Baths
3,103
Sq Ft
$596/Sq Ft
Est. Value
About This Home
This home is located at 594 Craig Ave, Paramus, NJ 07652 and is currently estimated at $1,850,474, approximately $596 per square foot. 594 Craig Ave is a home located in Bergen County with nearby schools including Paramus High School, Alpine Learning Group, and Paramus Catholic High School.
Ownership History
Date
Name
Owned For
Owner Type
Purchase Details
Closed on
Jul 15, 2019
Sold by
Rock Hammer Investments
Bought by
Li Tong and Zhu Bin
Current Estimated Value
Home Financials for this Owner
Home Financials are based on the most recent Mortgage that was taken out on this home.
Original Mortgage
$918,750
Outstanding Balance
$794,318
Interest Rate
3.2%
Mortgage Type
Adjustable Rate Mortgage/ARM
Estimated Equity
$1,056,156
Purchase Details
Closed on
Sep 22, 2017
Sold by
Ossi Michael K and Schuster Rosanne
Bought by
Rock Hammer Investments Llc
Home Financials for this Owner
Home Financials are based on the most recent Mortgage that was taken out on this home.
Original Mortgage
$363,750
Interest Rate
5.75%
Mortgage Type
Adjustable Rate Mortgage/ARM
Create a Home Valuation Report for This Property
The Home Valuation Report is an in-depth analysis detailing your home's value as well as a comparison with similar homes in the area
Home Values in the Area
Average Home Value in this Area
Purchase History
| Date | Buyer | Sale Price | Title Company |
|---|---|---|---|
| Li Tong | $1,225,000 | -- | |
| Rock Hammer Investments Llc | $485,000 | None Available |
Source: Public Records
Mortgage History
| Date | Status | Borrower | Loan Amount |
|---|---|---|---|
| Open | Li Tong | $918,750 | |
| Previous Owner | Rock Hammer Investments Llc | $363,750 |
Source: Public Records
Tax History
| Year | Tax Paid | Tax Assessment Tax Assessment Total Assessment is a certain percentage of the fair market value that is determined by local assessors to be the total taxable value of land and additions on the property. | Land | Improvement |
|---|---|---|---|---|
| 2025 | $21,007 | $1,473,500 | $393,800 | $1,079,700 |
| 2024 | $20,226 | $1,387,500 | $359,400 | $1,028,100 |
| 2023 | $19,215 | $1,318,500 | $342,200 | $976,300 |
| 2022 | $19,215 | $1,238,100 | $318,800 | $919,300 |
| 2021 | $18,658 | $1,135,500 | $289,400 | $846,100 |
| 2020 | $17,850 | $1,119,100 | $284,400 | $834,700 |
| 2019 | $7,110 | $383,100 | $258,100 | $125,000 |
| 2018 | $6,571 | $358,500 | $258,100 | $100,400 |
| 2017 | $6,457 | $358,500 | $258,100 | $100,400 |
| 2016 | $6,281 | $358,500 | $258,100 | $100,400 |
| 2015 | $5,966 | $358,500 | $258,100 | $100,400 |
| 2014 | $5,913 | $358,500 | $258,100 | $100,400 |
Source: Public Records
Map
Nearby Homes
- 159 Birchwood Rd
- 160 Reid Way
- 163 Birchwood Rd
- 164 Reid Way
- 597 Craig Ave
- 593 Craig Ave
- 167 Birchwood Rd
- 147 Birchwood Rd
- 601 Craig Ave
- 168 Reid Way
- 158 Birchwood Rd
- 154 Birchwood Rd
- 602 Craig Ave
- 160 Birchwood Rd
- 169 Birchwood Rd
- 163 Reid Way
- 150 Birchwood Rd
- 598 Freeland Ave
- 602 Freeland Ave
- 594 Freeland Ave
Your Personal Tour Guide
Ask me questions while you tour the home.