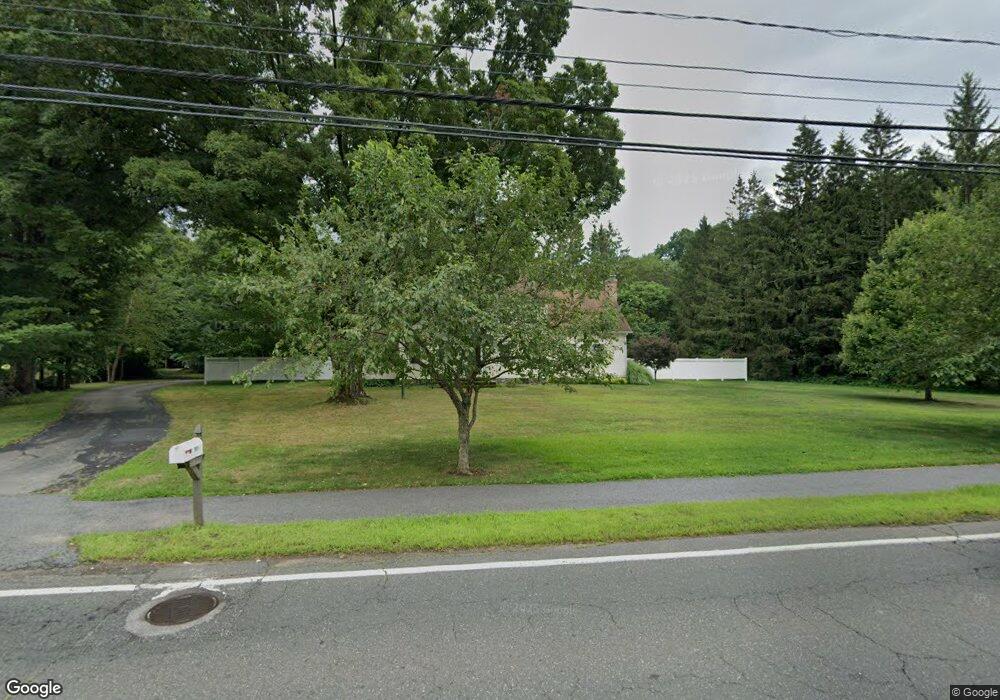
594 Main St Wilbraham, MA 01095
Estimated Value: $525,000 - $600,000
4
Beds
3
Baths
2,354
Sq Ft
$239/Sq Ft
Est. Value
About This Home
This home is located at 594 Main St, Wilbraham, MA 01095 and is currently estimated at $563,298, approximately $239 per square foot. 594 Main St is a home located in Hampden County with nearby schools including Minnechaug Regional High School, Springfield International Charter School, and Wilbraham & Monson Academy.
Ownership History
Date
Name
Owned For
Owner Type
Purchase Details
Closed on
Jun 5, 1995
Sold by
Allen Thomas E and Allen Thomas W
Bought by
Clark Jane E and Clark Charles P
Current Estimated Value
Home Financials for this Owner
Home Financials are based on the most recent Mortgage that was taken out on this home.
Original Mortgage
$144,400
Interest Rate
8.2%
Mortgage Type
Purchase Money Mortgage
Create a Home Valuation Report for This Property
The Home Valuation Report is an in-depth analysis detailing your home's value as well as a comparison with similar homes in the area
Home Values in the Area
Average Home Value in this Area
Purchase History
| Date | Buyer | Sale Price | Title Company |
|---|---|---|---|
| Clark Jane E | $148,000 | -- |
Source: Public Records
Mortgage History
| Date | Status | Borrower | Loan Amount |
|---|---|---|---|
| Open | Clark Jane E | $200,000 | |
| Closed | Clark Jane E | $60,000 | |
| Closed | Clark Jane E | $118,000 | |
| Closed | Clark Jane E | $144,400 |
Source: Public Records
Tax History Compared to Growth
Tax History
| Year | Tax Paid | Tax Assessment Tax Assessment Total Assessment is a certain percentage of the fair market value that is determined by local assessors to be the total taxable value of land and additions on the property. | Land | Improvement |
|---|---|---|---|---|
| 2025 | $8,228 | $460,200 | $127,100 | $333,100 |
| 2024 | $8,442 | $456,300 | $127,100 | $329,200 |
| 2023 | $8,032 | $417,000 | $127,100 | $289,900 |
| 2022 | $8,032 | $392,000 | $127,100 | $264,900 |
| 2021 | $7,007 | $305,200 | $109,900 | $195,300 |
| 2020 | $6,830 | $305,200 | $109,900 | $195,300 |
| 2019 | $6,656 | $305,300 | $109,900 | $195,400 |
| 2018 | $6,656 | $294,000 | $109,900 | $184,100 |
| 2017 | $6,468 | $294,000 | $109,900 | $184,100 |
| 2016 | $6,489 | $300,400 | $120,400 | $180,000 |
| 2015 | $6,272 | $300,400 | $120,400 | $180,000 |
Source: Public Records
Map
Nearby Homes
- 68 Monson Rd
- 1028 Tinkham Rd
- 6 Hilltop Park
- 8 Patriot Ridge Ln
- 6 Katie St
- 12 Highridge Rd
- 2 Bayberry Dr Unit 51
- 751 Ridge Rd
- 760 Stony Hill Rd
- 767 Stony Hill Rd
- 763 Stony Hill Rd
- 17 Peak Rd
- 14 Brookdale Dr
- 5 Edgewood Rd
- 474 Mountain Rd
- 407 Monson Rd
- 28 Decorie Dr
- 230V Burleigh Rd
- 5 Old Carriage Dr
- 500 Springfield St