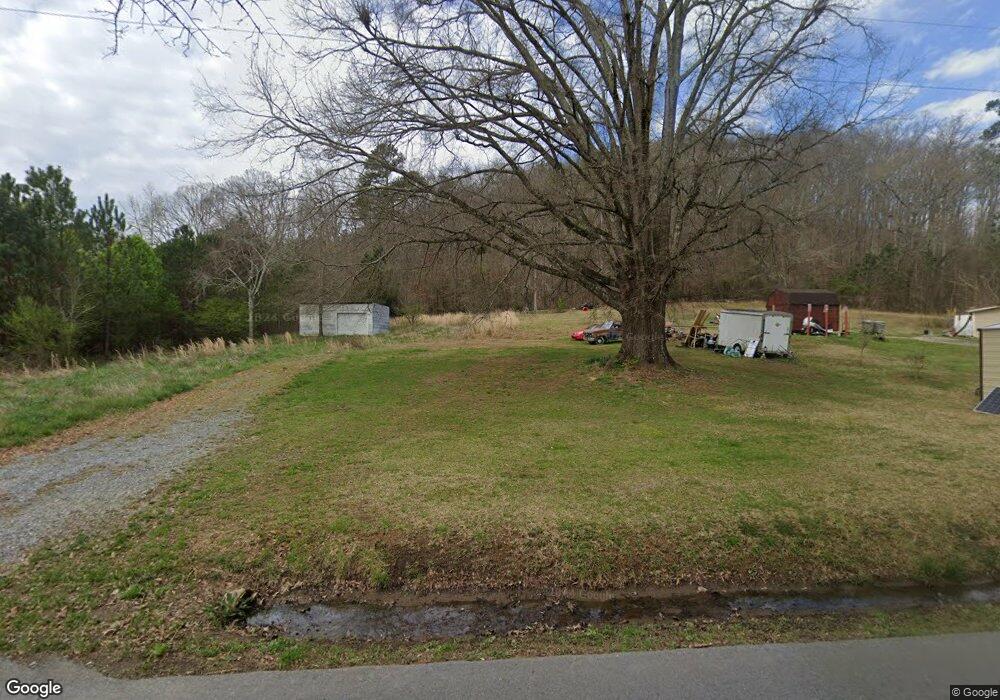
594 Morton Springs Rd Cedartown, GA 30125
Estimated Value: $53,509 - $185,000
--
Bed
--
Bath
768
Sq Ft
$159/Sq Ft
Est. Value
About This Home
This home is located at 594 Morton Springs Rd, Cedartown, GA 30125 and is currently estimated at $121,877, approximately $158 per square foot. 594 Morton Springs Rd is a home.
Ownership History
Date
Name
Owned For
Owner Type
Purchase Details
Closed on
Mar 28, 2011
Sold by
Glenn Jon
Bought by
Tillery Roger H
Current Estimated Value
Purchase Details
Closed on
Mar 4, 2009
Sold by
Glenn Seals T
Bought by
Glenn Jon
Purchase Details
Closed on
Jan 12, 1976
Sold by
Ogle Ethel D
Bought by
Glenn Scott T
Purchase Details
Closed on
Sep 5, 1974
Sold by
Hays Bobby G
Bought by
Ogle Ethel D
Purchase Details
Closed on
Apr 7, 1971
Sold by
Stroup James
Bought by
Hays Bobby G
Purchase Details
Closed on
Feb 5, 1970
Sold by
Jarrell Stella M
Bought by
Stroup James
Purchase Details
Closed on
Jul 27, 1966
Sold by
Barnette Raymond
Bought by
Jarrell Stella M
Purchase Details
Closed on
Sep 14, 1964
Sold by
Mid State Homes Inc
Bought by
Barnette Raymond
Purchase Details
Closed on
Dec 4, 1963
Sold by
Padgett Jerry L
Bought by
Mid State Homes Inc
Purchase Details
Closed on
Aug 2, 1963
Sold by
Mid State Homes Corp
Bought by
Padgett Jerry L
Purchase Details
Closed on
Dec 11, 1961
Bought by
Mid State Homes Corp
Create a Home Valuation Report for This Property
The Home Valuation Report is an in-depth analysis detailing your home's value as well as a comparison with similar homes in the area
Home Values in the Area
Average Home Value in this Area
Purchase History
| Date | Buyer | Sale Price | Title Company |
|---|---|---|---|
| Tillery Roger H | $18,000 | -- | |
| Glenn Jon | -- | -- | |
| Glenn Scott T | -- | -- | |
| Ogle Ethel D | -- | -- | |
| Hays Bobby G | -- | -- | |
| Stroup James | -- | -- | |
| Jarrell Stella M | -- | -- | |
| Barnette Raymond | -- | -- | |
| Mid State Homes Inc | -- | -- | |
| Padgett Jerry L | -- | -- | |
| Mid State Homes Corp | -- | -- |
Source: Public Records
Tax History Compared to Growth
Tax History
| Year | Tax Paid | Tax Assessment Tax Assessment Total Assessment is a certain percentage of the fair market value that is determined by local assessors to be the total taxable value of land and additions on the property. | Land | Improvement |
|---|---|---|---|---|
| 2024 | $51 | $2,430 | $2,084 | $346 |
| 2023 | $58 | $2,430 | $2,084 | $346 |
| 2022 | $41 | $1,736 | $1,390 | $346 |
| 2021 | $42 | $1,736 | $1,390 | $346 |
| 2020 | $42 | $1,736 | $1,390 | $346 |
| 2019 | $57 | $843 | $1,390 | $843 |
| 2018 | $59 | $2,136 | $1,390 | $746 |
| 2017 | $67 | $2,458 | $1,457 | $1,001 |
| 2016 | $65 | $2,406 | $1,406 | $1,001 |
| 2015 | $66 | $2,406 | $1,406 | $1,001 |
| 2014 | $66 | $2,406 | $1,406 | $1,001 |
Source: Public Records
Map
Nearby Homes
- 00 Antioch Rd
- 766 Antioch Rd
- 95 Wieuca Way
- 000 Wieuca Way
- 0 Wieuca Way Unit 10614129
- 142 Acres On Judkin Mill Rd
- 00 Buchanan Hwy
- 1987 Buchanan Hwy
- 35 Old Mill Rd
- 160 Tate Rd
- 497 Judkin Mill Rd
- 203 Cason Rd
- 0 Buchanan Hwy Unit 10558945
- 0 Youngs Farm Rd Unit 24829378
- 117 Cason Rd
- 205 Pinecrest Rd
- 0 Old Esom Hill Loop Unit 7654342
- 0 Old Esom Hill Loop Unit 10611077
- 1345 Lees Chapel Rd
- 0 Coaling Rd Unit 9221-D 10352096
- 580 Morton Springs Rd
- 587 Morton Springs Rd
- 597 Morton Springs Rd
- 577 Morton Springs Rd
- 617 Morton Springs Rd
- 567 Morton Springs Rd
- 557 Morton Springs Rd
- 631 Morton Springs Rd
- 300 Huntington Rd
- 547 Morton Springs Rd
- 641 Morton Springs Rd
- 0 Huntington Rd Unit 7373767
- 0 Huntington Rd Unit 8137191
- 0 Huntington Rd Unit 3220007
- 0 Huntington Rd
- 535 Morton Springs Rd
- 651 Morton Springs Rd
- 525 Morton Springs Rd
- 515 Morton Springs Rd
- 505 Morton Springs Rd