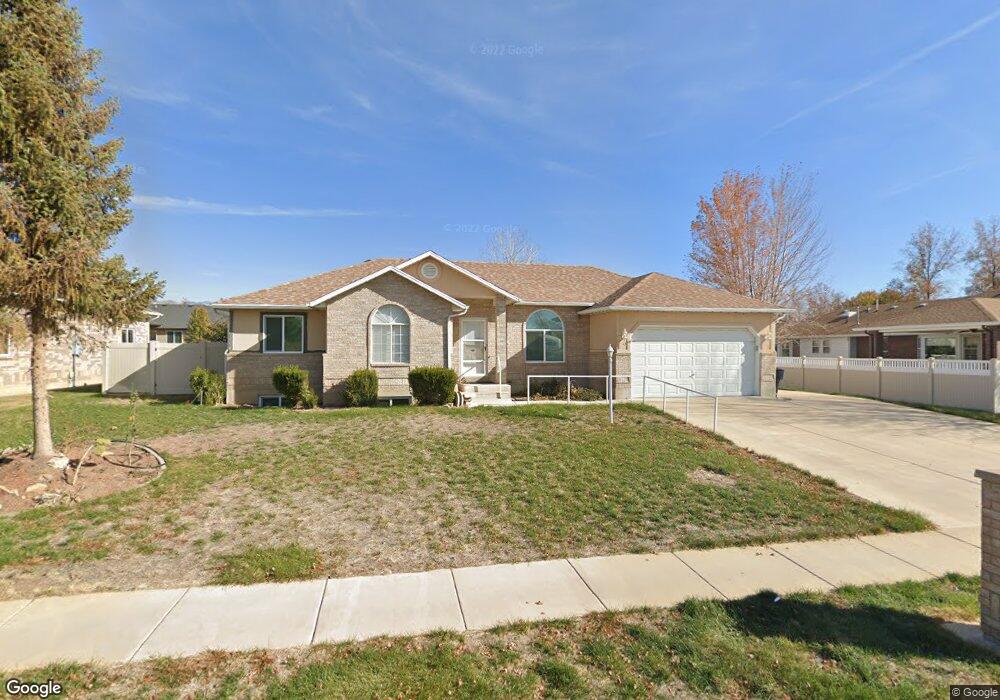
594 N 2100 W Clearfield, UT 84015
Estimated Value: $528,000 - $591,000
5
Beds
3
Baths
2,850
Sq Ft
$196/Sq Ft
Est. Value
About This Home
This home is located at 594 N 2100 W, Clearfield, UT 84015 and is currently estimated at $558,727, approximately $196 per square foot. 594 N 2100 W is a home located in Davis County with nearby schools including Lakeside School, West Point Junior High School, and Syracuse High School.
Ownership History
Date
Name
Owned For
Owner Type
Purchase Details
Closed on
Apr 8, 2016
Sold by
Parker Willard Dennis and Parker Drew Bell
Bought by
Christensen Trealyn
Current Estimated Value
Purchase Details
Closed on
Jan 15, 2013
Sold by
Parker Willard S and Parker Shirley B
Bought by
Parker Willard S and Parker Shirley B
Purchase Details
Closed on
Dec 6, 2012
Sold by
Craig Martha M
Bought by
Parker Willard S and Parker Shirley B
Purchase Details
Closed on
Dec 28, 2010
Sold by
Craig Martha M
Bought by
Craig Martha M
Home Financials for this Owner
Home Financials are based on the most recent Mortgage that was taken out on this home.
Original Mortgage
$97,900
Interest Rate
3.71%
Mortgage Type
New Conventional
Purchase Details
Closed on
Jun 16, 2005
Sold by
Craig Martha M
Bought by
Craig Martha M
Purchase Details
Closed on
Jun 13, 2003
Sold by
Craig Martha M
Bought by
Craig Martha M
Create a Home Valuation Report for This Property
The Home Valuation Report is an in-depth analysis detailing your home's value as well as a comparison with similar homes in the area
Home Values in the Area
Average Home Value in this Area
Purchase History
| Date | Buyer | Sale Price | Title Company |
|---|---|---|---|
| Christensen Trealyn | -- | Stewart Title | |
| Parker Willard S | -- | None Available | |
| Parker Willard S | -- | Mountain View Title | |
| Craig Martha M | -- | Bonneville Superior Title Co | |
| Craig Martha M | -- | Bonneville Superior Title Co | |
| Craig Martha M | -- | -- | |
| Craig Martha M | -- | First American Title Co |
Source: Public Records
Mortgage History
| Date | Status | Borrower | Loan Amount |
|---|---|---|---|
| Previous Owner | Craig Martha M | $97,900 |
Source: Public Records
Tax History Compared to Growth
Tax History
| Year | Tax Paid | Tax Assessment Tax Assessment Total Assessment is a certain percentage of the fair market value that is determined by local assessors to be the total taxable value of land and additions on the property. | Land | Improvement |
|---|---|---|---|---|
| 2025 | $2,958 | $277,200 | $110,081 | $167,119 |
| 2024 | $2,857 | $268,950 | $99,120 | $169,830 |
| 2023 | $2,662 | $461,000 | $122,681 | $338,319 |
| 2022 | $2,878 | $272,800 | $63,573 | $209,227 |
| 2021 | $2,581 | $366,000 | $100,269 | $265,731 |
| 2020 | $2,273 | $318,000 | $84,063 | $233,937 |
| 2019 | $2,189 | $302,000 | $81,609 | $220,391 |
| 2018 | $2,015 | $274,000 | $81,988 | $192,012 |
| 2016 | $1,860 | $133,100 | $31,706 | $101,394 |
| 2015 | $1,764 | $119,625 | $31,706 | $87,919 |
| 2014 | $1,645 | $113,090 | $31,706 | $81,384 |
| 2013 | -- | $105,345 | $38,556 | $66,789 |
Source: Public Records
Map
Nearby Homes
- 607 N 2000 W
- 2283 W 470 N
- 2132 W 800 N
- 2348 W 800 N
- 1805 W 675 N
- 1832 W 725 N
- 1827 W 775 N
- 1774 W 400 N
- 2535 W 550 N
- 1652 W 560 N
- 878 N 2600 W
- 12 N 2000 W Unit 1
- 47 N 1750 W
- 575 N 1350 W Unit 137
- 1828 W 75 S
- 1350 W 300 N Unit 49
- 1350 W 300 N Unit 38
- 1350 W 300 N Unit 29
- 2371 W 1300 N
- 563 N 1350 W Unit 139