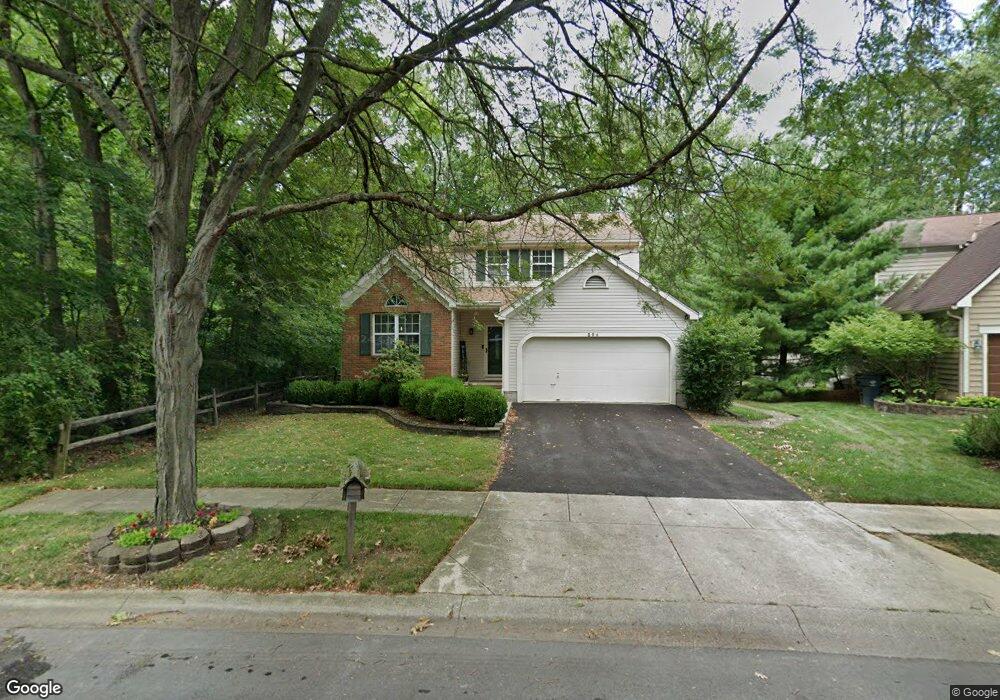
594 Thistle Ave Columbus, OH 43230
Woodside Green NeighborhoodEstimated Value: $390,000 - $459,000
3
Beds
4
Baths
1,975
Sq Ft
$217/Sq Ft
Est. Value
About This Home
This home is located at 594 Thistle Ave, Columbus, OH 43230 and is currently estimated at $427,678, approximately $216 per square foot. 594 Thistle Ave is a home located in Franklin County with nearby schools including Royal Manor Elementary School, Gahanna West Middle School, and Lincoln High School.
Ownership History
Date
Name
Owned For
Owner Type
Purchase Details
Closed on
May 27, 2011
Sold by
Burley Debra L
Bought by
Kelley Daniel M and Kelley Jennifer C
Current Estimated Value
Home Financials for this Owner
Home Financials are based on the most recent Mortgage that was taken out on this home.
Original Mortgage
$151,920
Outstanding Balance
$104,839
Interest Rate
4.96%
Mortgage Type
New Conventional
Estimated Equity
$322,839
Purchase Details
Closed on
Apr 30, 2001
Sold by
Pfister Stephen C and Pfister Donna L
Bought by
Burley Debra L
Home Financials for this Owner
Home Financials are based on the most recent Mortgage that was taken out on this home.
Original Mortgage
$140,000
Interest Rate
6.95%
Purchase Details
Closed on
Sep 19, 1995
Sold by
Chinn Stephen G
Bought by
Pfister Stephen C and Pfister Donna L
Purchase Details
Closed on
Dec 24, 1992
Purchase Details
Closed on
Oct 1, 1992
Create a Home Valuation Report for This Property
The Home Valuation Report is an in-depth analysis detailing your home's value as well as a comparison with similar homes in the area
Home Values in the Area
Average Home Value in this Area
Purchase History
| Date | Buyer | Sale Price | Title Company |
|---|---|---|---|
| Kelley Daniel M | $189,900 | Talon Group | |
| Burley Debra L | $175,000 | Foundation Title Agency Inc | |
| Pfister Stephen C | $149,900 | -- | |
| -- | $125,200 | -- | |
| -- | $27,500 | -- |
Source: Public Records
Mortgage History
| Date | Status | Borrower | Loan Amount |
|---|---|---|---|
| Open | Kelley Daniel M | $151,920 | |
| Closed | Burley Debra L | $140,000 | |
| Closed | Pfister Stephen C | -- |
Source: Public Records
Tax History
| Year | Tax Paid | Tax Assessment Tax Assessment Total Assessment is a certain percentage of the fair market value that is determined by local assessors to be the total taxable value of land and additions on the property. | Land | Improvement |
|---|---|---|---|---|
| 2025 | $7,402 | $125,650 | $31,500 | $94,150 |
| 2024 | $7,402 | $125,650 | $31,500 | $94,150 |
| 2023 | $7,309 | $125,650 | $31,500 | $94,150 |
| 2022 | $6,148 | $82,330 | $14,180 | $68,150 |
| 2021 | $5,946 | $82,330 | $14,180 | $68,150 |
| 2020 | $5,896 | $82,330 | $14,180 | $68,150 |
| 2019 | $4,891 | $68,150 | $11,830 | $56,320 |
| 2018 | $2,428 | $68,150 | $11,830 | $56,320 |
| 2017 | $4,489 | $68,150 | $11,830 | $56,320 |
| 2016 | $4,481 | $61,950 | $13,160 | $48,790 |
| 2015 | $2,242 | $61,950 | $13,160 | $48,790 |
| 2014 | $4,450 | $61,950 | $13,160 | $48,790 |
| 2013 | $2,210 | $61,950 | $13,160 | $48,790 |
Source: Public Records
Map
Nearby Homes
- 536 Springwood Lake Dr
- 830 Lindenhaven Rd
- 3877 Hines Rd
- 613 Mistletoe St
- 3455 Halpern St
- 956 Crystal Cay Ct
- 4672 Sperry Ave
- 3555 Tami Place
- 0 Wendler Blvd
- 586 Pinegrove Place
- 475 Denwood Ct
- 424 Lincolnshire Rd
- 427 Canfield Dr
- 439 Canterwood Ct
- 464 Foxwood Dr
- 595 Deerwood Ave E
- 388 Elkwood Place
- 394 Banbury Dr
- 395 Amesbury Dr
- 4125 Emerius Dr
- 590 Thistle Ave
- 588 Thistle Ave
- 595 Thistle Ave
- 582 Thistle Ave
- 620 Thistle Ave
- 587 Thistle Ave
- 615 Thistle Ave
- 576 Thistle Ave
- 760 Mimosa Place
- 626 Thistle Ave
- 583 Thistle Ave
- 754 Mimosa Place
- 617 Mistletoe Ct
- 572 Thistle Ave
- 611 Mistletoe Ct
- 632 Thistle Ave
- 577 Thistle Ave
- 748 Mimosa Place
- 575 Thistle Ave
- 566 Thistle Ave
Your Personal Tour Guide
Ask me questions while you tour the home.