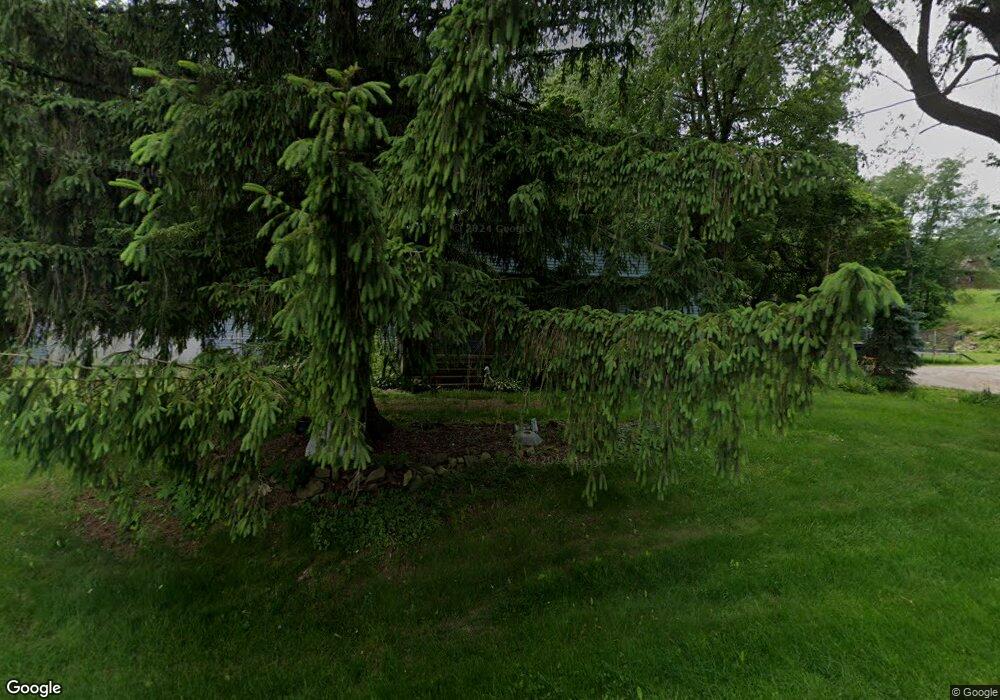
594 W Comet Rd New Franklin, OH 44216
Estimated Value: $165,000 - $222,000
3
Beds
1
Bath
810
Sq Ft
$227/Sq Ft
Est. Value
About This Home
This home is located at 594 W Comet Rd, New Franklin, OH 44216 and is currently estimated at $184,108, approximately $227 per square foot. 594 W Comet Rd is a home located in Summit County with nearby schools including Manchester Middle School, Nolley Elementary School, and Manchester High School.
Ownership History
Date
Name
Owned For
Owner Type
Purchase Details
Closed on
Jan 6, 2023
Sold by
Vieland Robert
Bought by
Mazzagatti Patrick S and Mazzagatti Shelly L
Current Estimated Value
Purchase Details
Closed on
Mar 16, 2010
Sold by
Timura Roger A
Bought by
Timura Lea L
Purchase Details
Closed on
Jul 29, 2005
Sold by
Kerr Richard A and Kerr Theresa K
Bought by
Timura Roger A and Timura Lea L
Home Financials for this Owner
Home Financials are based on the most recent Mortgage that was taken out on this home.
Original Mortgage
$93,600
Interest Rate
5.71%
Mortgage Type
Fannie Mae Freddie Mac
Purchase Details
Closed on
Aug 11, 1999
Sold by
Goble Douglas D and Goble Cynthia K
Bought by
Kerr Richard A
Home Financials for this Owner
Home Financials are based on the most recent Mortgage that was taken out on this home.
Original Mortgage
$104,550
Interest Rate
7.61%
Mortgage Type
VA
Create a Home Valuation Report for This Property
The Home Valuation Report is an in-depth analysis detailing your home's value as well as a comparison with similar homes in the area
Home Values in the Area
Average Home Value in this Area
Purchase History
| Date | Buyer | Sale Price | Title Company |
|---|---|---|---|
| Mazzagatti Patrick S | $100,000 | None Listed On Document | |
| Timura Lea L | -- | Attorney | |
| Timura Roger A | $117,000 | Bond & Associates Title Agen | |
| Kerr Richard A | $102,500 | Midland Commerce Group |
Source: Public Records
Mortgage History
| Date | Status | Borrower | Loan Amount |
|---|---|---|---|
| Previous Owner | Timura Roger A | $93,600 | |
| Previous Owner | Kerr Richard A | $104,550 |
Source: Public Records
Tax History Compared to Growth
Tax History
| Year | Tax Paid | Tax Assessment Tax Assessment Total Assessment is a certain percentage of the fair market value that is determined by local assessors to be the total taxable value of land and additions on the property. | Land | Improvement |
|---|---|---|---|---|
| 2025 | $2,758 | $52,161 | $12,915 | $39,246 |
| 2024 | $2,758 | $52,161 | $12,915 | $39,246 |
| 2023 | $2,758 | $52,161 | $12,915 | $39,246 |
| 2022 | $2,009 | $40,033 | $9,639 | $30,394 |
| 2021 | $2,016 | $40,033 | $9,639 | $30,394 |
| 2020 | $1,981 | $40,030 | $9,640 | $30,390 |
| 2019 | $2,179 | $39,600 | $11,780 | $27,820 |
| 2018 | $1,881 | $39,600 | $11,780 | $27,820 |
| 2017 | $1,778 | $39,600 | $11,780 | $27,820 |
| 2016 | $1,757 | $35,170 | $11,780 | $23,390 |
| 2015 | $1,778 | $35,170 | $11,780 | $23,390 |
| 2014 | $1,765 | $35,170 | $11,780 | $23,390 |
| 2013 | $1,757 | $35,170 | $11,780 | $23,390 |
Source: Public Records
Map
Nearby Homes
- 0 W Comet Rd Unit 5079117
- 7060 Manchester Rd
- 6407 Southview Dr
- 11391 Michelle Dr NW
- 8257 Akron Ave NW
- 0 Babst Ave NW
- 451 Yager Rd
- 5983 Weaver Rd
- 8714 Greenmeadow Ave NW
- 8470 Shadyview Ave NW
- 7709 Brownwood Ave NW
- 6387 Hampsher Rd
- 9125 Paulding St NW
- 963 Saint Brendan Dr
- 6090 Manchester Rd Unit 6096
- 912 Tamwood Dr
- Ballenger w/ Basement Plan at Heritage Village
- Columbia w/ Basement Plan at Heritage Village
- Allegheny w/ Basement Plan at Heritage Village
- Hudson w/ Basement Plan at Heritage Village