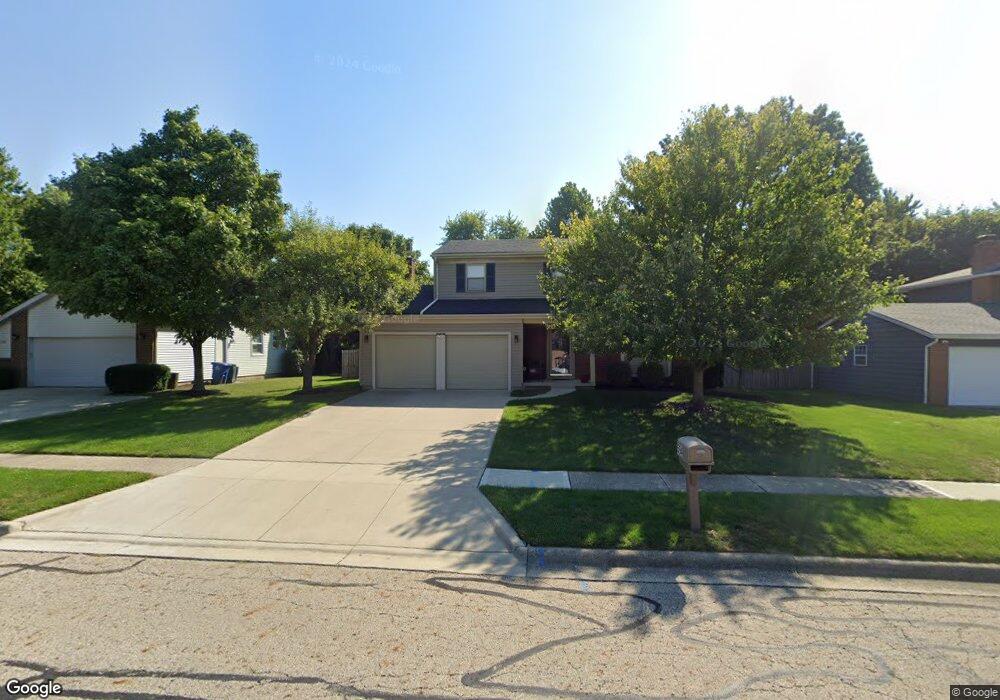
594 Wickham Way Columbus, OH 43230
Estimated Value: $400,000 - $438,000
4
Beds
3
Baths
2,177
Sq Ft
$190/Sq Ft
Est. Value
About This Home
This home is located at 594 Wickham Way, Columbus, OH 43230 and is currently estimated at $413,444, approximately $189 per square foot. 594 Wickham Way is a home located in Franklin County with nearby schools including Jefferson Elementary School, Gahanna East Middle School, and Lincoln High School.
Ownership History
Date
Name
Owned For
Owner Type
Purchase Details
Closed on
Jun 30, 2008
Sold by
Fehlen Kevin M and Fehlen Susan M
Bought by
Butler Nathaniel T and Butler Mindy M
Current Estimated Value
Home Financials for this Owner
Home Financials are based on the most recent Mortgage that was taken out on this home.
Original Mortgage
$160,000
Outstanding Balance
$102,643
Interest Rate
5.96%
Mortgage Type
Purchase Money Mortgage
Estimated Equity
$310,801
Purchase Details
Closed on
Jun 8, 2006
Sold by
Evans Gary L and Evans Deborah L
Bought by
Fehlen Kevin M and Fehlen Susan M
Home Financials for this Owner
Home Financials are based on the most recent Mortgage that was taken out on this home.
Original Mortgage
$162,000
Interest Rate
6.68%
Mortgage Type
Fannie Mae Freddie Mac
Purchase Details
Closed on
Oct 31, 1989
Bought by
Evans Gary L and Evans Deborah L
Purchase Details
Closed on
Apr 28, 1989
Create a Home Valuation Report for This Property
The Home Valuation Report is an in-depth analysis detailing your home's value as well as a comparison with similar homes in the area
Home Values in the Area
Average Home Value in this Area
Purchase History
| Date | Buyer | Sale Price | Title Company |
|---|---|---|---|
| Butler Nathaniel T | $200,000 | Talon | |
| Fehlen Kevin M | $192,000 | Title First | |
| Evans Gary L | $98,500 | -- | |
| -- | $97,500 | -- |
Source: Public Records
Mortgage History
| Date | Status | Borrower | Loan Amount |
|---|---|---|---|
| Open | Butler Nathaniel T | $160,000 | |
| Closed | Fehlen Kevin M | $162,000 |
Source: Public Records
Tax History Compared to Growth
Tax History
| Year | Tax Paid | Tax Assessment Tax Assessment Total Assessment is a certain percentage of the fair market value that is determined by local assessors to be the total taxable value of land and additions on the property. | Land | Improvement |
|---|---|---|---|---|
| 2024 | $6,996 | $118,760 | $33,250 | $85,510 |
| 2023 | $6,909 | $118,755 | $33,250 | $85,505 |
| 2022 | $5,933 | $79,450 | $12,040 | $67,410 |
| 2021 | $5,738 | $79,450 | $12,040 | $67,410 |
| 2020 | $5,690 | $79,450 | $12,040 | $67,410 |
| 2019 | $4,806 | $66,960 | $10,050 | $56,910 |
| 2018 | $4,546 | $66,960 | $10,050 | $56,910 |
| 2017 | $4,364 | $66,960 | $10,050 | $56,910 |
| 2016 | $4,317 | $59,680 | $13,620 | $46,060 |
| 2015 | $4,320 | $59,680 | $13,620 | $46,060 |
| 2014 | $4,287 | $59,680 | $13,620 | $46,060 |
| 2013 | $2,105 | $59,010 | $12,950 | $46,060 |
Source: Public Records
Map
Nearby Homes
- 641 Sycamore Mill Dr
- 365 Sycamore Woods Ln Unit 365
- 302 Zander Ln Unit 302
- 477 Stratshire Ln
- 804 Riva Ridge Blvd
- 638 Churchill Dr
- 211 Crossing Creek N
- 3311 Longstreth Park Place
- 4220 E Johnstown Rd
- 219 N Hamilton Rd
- 0 Beecher Crossing
- 206 Lintner St
- 488 Three Oaks Ct Unit 488
- 108 Walcreek Dr W
- 777 Dark Star Ave
- 900 Old Pine Dr
- 111 Nob Hill Dr N
- 1035 Riva Ridge Blvd
- 4574 N Hamilton Rd
- 636 Grove Cir Unit 1803
- 596 Wickham Way
- 592 Wickham Way
- 577 Haversham Ct N
- 598 Wickham Way
- 590 Wickham Way
- 585 Haversham Ct N
- 595 Wickham Way
- 597 Wickham Way
- 593 Wickham Way
- 536 Haversham Dr
- 588 Wickham Way
- 599 Wickham Way
- 591 Wickham Way
- 606 Sycamore Mill Dr
- 520 Haversham Dr
- 588 Haversham Ct N
- 608 Sycamore Mill Dr
- 589 Wickham Way
- 607 Millwood Ct
- 610 Sycamore Mill Dr