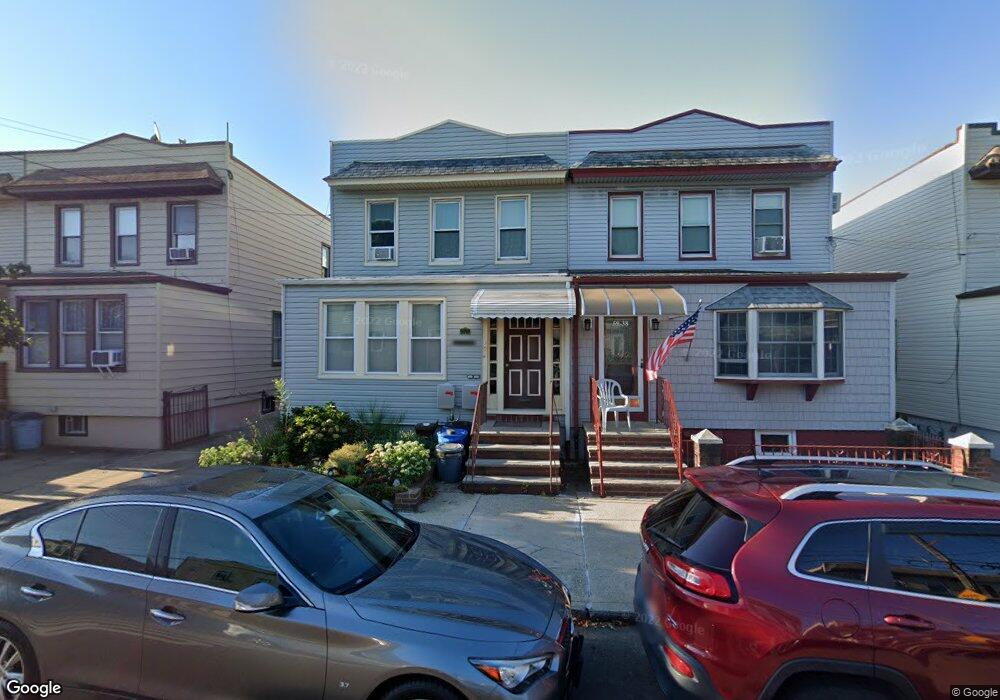
5940 57th Dr Maspeth, NY 11378
Maspeth NeighborhoodEstimated Value: $834,000 - $931,000
Studio
--
Bath
1,700
Sq Ft
$520/Sq Ft
Est. Value
About This Home
This home is located at 5940 57th Dr, Maspeth, NY 11378 and is currently estimated at $883,635, approximately $519 per square foot. 5940 57th Dr is a home located in Queens County with nearby schools including P.S. 153 Maspeth, IS 73 - The Frank Sansivieri School, and Grover Cleveland High School.
Ownership History
Date
Name
Owned For
Owner Type
Purchase Details
Closed on
May 24, 2001
Sold by
Soorko Egor P
Bought by
Rohdin Peter and Rohdin Myrna E
Current Estimated Value
Home Financials for this Owner
Home Financials are based on the most recent Mortgage that was taken out on this home.
Original Mortgage
$238,500
Outstanding Balance
$89,385
Interest Rate
7.08%
Estimated Equity
$794,250
Purchase Details
Closed on
Feb 16, 2001
Sold by
Soorko Anna
Bought by
Soorko Egor P
Create a Home Valuation Report for This Property
The Home Valuation Report is an in-depth analysis detailing your home's value as well as a comparison with similar homes in the area
Home Values in the Area
Average Home Value in this Area
Purchase History
| Date | Buyer | Sale Price | Title Company |
|---|---|---|---|
| Rohdin Peter | -- | -- | |
| Soorko Egor P | -- | -- |
Source: Public Records
Mortgage History
| Date | Status | Borrower | Loan Amount |
|---|---|---|---|
| Open | Rohdin Peter | $238,500 |
Source: Public Records
Tax History
| Year | Tax Paid | Tax Assessment Tax Assessment Total Assessment is a certain percentage of the fair market value that is determined by local assessors to be the total taxable value of land and additions on the property. | Land | Improvement |
|---|---|---|---|---|
| 2025 | $7,322 | $38,640 | $6,814 | $31,826 |
| 2024 | $7,322 | $36,454 | $7,655 | $28,799 |
| 2023 | $6,907 | $34,391 | $6,472 | $27,919 |
| 2022 | $477 | $53,220 | $11,100 | $42,120 |
| 2021 | $6,828 | $53,460 | $11,100 | $42,360 |
| 2020 | $3,667 | $48,960 | $11,100 | $37,860 |
| 2019 | $6,355 | $53,940 | $11,100 | $42,840 |
| 2018 | $5,842 | $28,659 | $6,395 | $22,264 |
| 2017 | $5,512 | $27,038 | $7,015 | $20,023 |
| 2016 | $5,405 | $27,038 | $7,015 | $20,023 |
| 2015 | $2,857 | $26,833 | $10,765 | $16,068 |
| 2014 | $2,857 | $25,315 | $9,505 | $15,810 |
Source: Public Records
Map
Nearby Homes
Your Personal Tour Guide
Ask me questions while you tour the home.