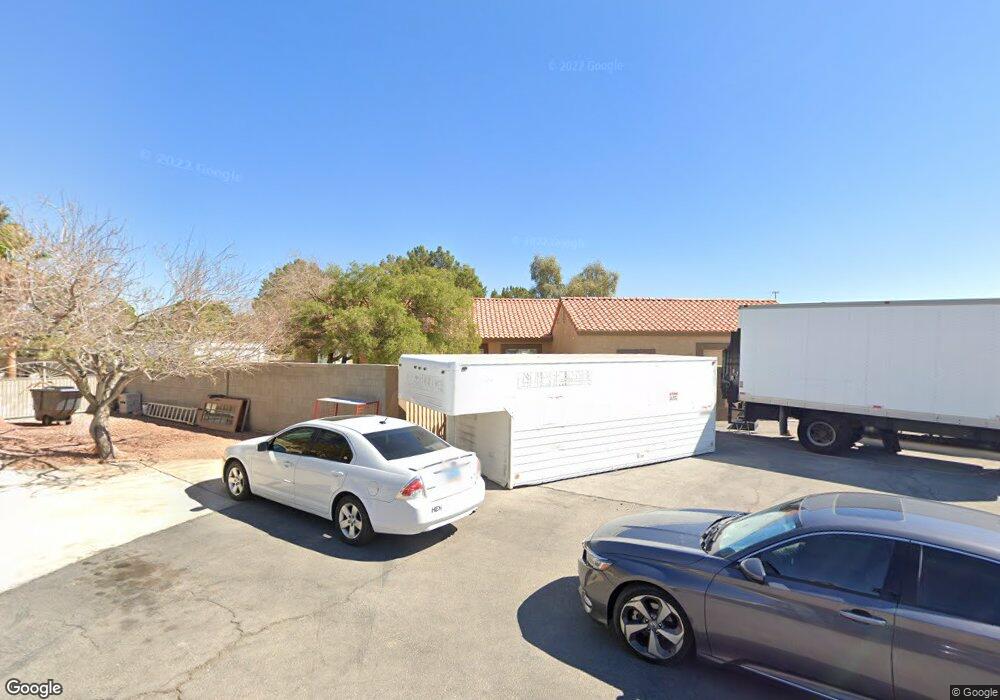
5940 Sobb Ave Las Vegas, NV 89118
Estimated Value: $675,000 - $919,000
3
Beds
3
Baths
2,371
Sq Ft
$337/Sq Ft
Est. Value
About This Home
This home is located at 5940 Sobb Ave, Las Vegas, NV 89118 and is currently estimated at $799,358, approximately $337 per square foot. 5940 Sobb Ave is a home located in Clark County with nearby schools including Helen Jydstrup Elementary School, Grant Sawyer Middle School, and Durango High School.
Ownership History
Date
Name
Owned For
Owner Type
Purchase Details
Closed on
Mar 31, 2008
Sold by
Henson Thelma M and Henson Suzanne K
Bought by
Henson Thelma M and Henson Suzanne K
Current Estimated Value
Purchase Details
Closed on
Mar 2, 2000
Sold by
Shiloff Edward
Bought by
Hensen Thelma M and Hensen Suzanne K
Purchase Details
Closed on
Sep 19, 1997
Sold by
Shiloff Mary Alice
Bought by
Shiloff Edward
Home Financials for this Owner
Home Financials are based on the most recent Mortgage that was taken out on this home.
Original Mortgage
$25,000
Interest Rate
7.44%
Purchase Details
Closed on
Sep 9, 1997
Sold by
Hopcus Jason D and Hopcus Christine
Bought by
Shiloff Edward
Home Financials for this Owner
Home Financials are based on the most recent Mortgage that was taken out on this home.
Original Mortgage
$25,000
Interest Rate
7.44%
Create a Home Valuation Report for This Property
The Home Valuation Report is an in-depth analysis detailing your home's value as well as a comparison with similar homes in the area
Home Values in the Area
Average Home Value in this Area
Purchase History
| Date | Buyer | Sale Price | Title Company |
|---|---|---|---|
| Henson Thelma M | -- | None Available | |
| Hensen Thelma M | $208,400 | First American Title Co | |
| Shiloff Edward | -- | First American Title Co | |
| Shiloff Edward | -- | Old Republic Title Company | |
| Shiloff Edward | $47,500 | Old Republic Title Company |
Source: Public Records
Mortgage History
| Date | Status | Borrower | Loan Amount |
|---|---|---|---|
| Previous Owner | Shiloff Edward | $25,000 |
Source: Public Records
Tax History Compared to Growth
Tax History
| Year | Tax Paid | Tax Assessment Tax Assessment Total Assessment is a certain percentage of the fair market value that is determined by local assessors to be the total taxable value of land and additions on the property. | Land | Improvement |
|---|---|---|---|---|
| 2025 | $2,751 | $170,925 | $73,500 | $97,425 |
| 2024 | $2,671 | $170,925 | $73,500 | $97,425 |
| 2023 | $2,671 | $153,005 | $61,250 | $91,755 |
| 2022 | $2,593 | $138,217 | $54,250 | $83,967 |
| 2021 | $2,518 | $128,804 | $49,000 | $79,804 |
| 2020 | $2,441 | $128,218 | $49,000 | $79,218 |
| 2019 | $2,370 | $121,784 | $43,750 | $78,034 |
| 2018 | $2,301 | $115,345 | $40,250 | $75,095 |
| 2017 | $3,299 | $112,474 | $35,000 | $77,474 |
| 2016 | $2,179 | $88,975 | $28,000 | $60,975 |
| 2015 | $2,175 | $71,946 | $26,250 | $45,696 |
| 2014 | $2,111 | $73,981 | $17,500 | $56,481 |
Source: Public Records
Map
Nearby Homes
- 5829 W Patrick Ln
- 6315 Bellisima St
- 5880 W Post Rd
- 0 W Patrick Ln Unit 2718906
- 0 W Patrick Ln Unit 2675444
- 5875 W Post Rd
- 5801 Exbury Gardens Ct
- 0 Unit 2701179
- 0 S Lindell Rd
- 0 Woodstock
- 6285 Mohawk St
- 5332 Avory Peak Ct
- 5790 Westwind Rd
- 5990 Viscaya Grove St
- 5910 W Post Rd
- 5770 El Camino Rd
- 0 Mohawk St Unit 2675414
- 6053 Conroe Ct
- 6210 W Quail Ave
- 0 W Unit 2633036
- 5960 Sobb Ave
- 5970 Sobb Ave
- 6120 Red Rock St
- 5895 W Patrick Ln
- 5950 Sobb Ave
- 5905 W Patrick Ln
- 5935 W Patrick Ln
- 5897 W Patrick Ln
- 5893 W Patrick Ln
- 5891 W Patrick Ln
- 0 Quail St Unit 1208663
- 0 Quail St Unit 1208656
- 0 Quail St Unit 1901670
- 0 Quail St Unit 2086775
- 00 Sobb Ave
- 5801 Sobb Ave
- 0 Sobb Ave
- 5780 Sobb Ave
- 5940 W Patrick Ln
- 6225 Duneville St