5940 Tarpn Gardns Cir Unit 102 Cape Coral, FL 33914
Pelican NeighborhoodEstimated Value: $503,000 - $666,000
2
Beds
2
Baths
1,990
Sq Ft
$285/Sq Ft
Est. Value
About This Home
This home is located at 5940 Tarpn Gardns Cir Unit 102, Cape Coral, FL 33914 and is currently estimated at $567,560, approximately $285 per square foot. 5940 Tarpn Gardns Cir Unit 102 is a home located in Lee County with nearby schools including Cape Elementary School, Caloosa Elementary School, and Tropic Isles Elementary School.
Ownership History
Date
Name
Owned For
Owner Type
Purchase Details
Closed on
Oct 11, 2017
Sold by
Young Mary J and Young Daisley Young
Bought by
Harry H Eastman Jr Living Trust and Eastman Harry H
Current Estimated Value
Home Financials for this Owner
Home Financials are based on the most recent Mortgage that was taken out on this home.
Interest Rate
3.85%
Purchase Details
Closed on
Sep 25, 2014
Sold by
Young Daisley and Young Mary Jane
Bought by
Young Daisley A and Revoca Jane Young Revoca
Purchase Details
Closed on
Oct 22, 2012
Sold by
Brigley Daniel L and Brigley Penny A
Bought by
Young Daisley and Young Mary Jane
Purchase Details
Closed on
Jun 1, 2005
Sold by
Degraff Don A and De Graff Nyla J
Bought by
Brigley Daniel L and Brigley Penny A
Home Financials for this Owner
Home Financials are based on the most recent Mortgage that was taken out on this home.
Original Mortgage
$347,100
Interest Rate
5.69%
Mortgage Type
Fannie Mae Freddie Mac
Create a Home Valuation Report for This Property
The Home Valuation Report is an in-depth analysis detailing your home's value as well as a comparison with similar homes in the area
Home Values in the Area
Average Home Value in this Area
Purchase History
| Date | Buyer | Sale Price | Title Company |
|---|---|---|---|
| Harry H Eastman Jr Living Trust | $379,000 | -- | |
| Young Daisley A | -- | Attorney | |
| Young Daisley | $265,000 | Florida Title & Guarantee | |
| Brigley Daniel L | $433,900 | Fidelity National Title Ins |
Source: Public Records
Mortgage History
| Date | Status | Borrower | Loan Amount |
|---|---|---|---|
| Closed | Harry H Eastman Jr Living Trust | -- | |
| Previous Owner | Brigley Daniel L | $347,100 |
Source: Public Records
Tax History Compared to Growth
Tax History
| Year | Tax Paid | Tax Assessment Tax Assessment Total Assessment is a certain percentage of the fair market value that is determined by local assessors to be the total taxable value of land and additions on the property. | Land | Improvement |
|---|---|---|---|---|
| 2025 | $4,742 | $301,914 | -- | -- |
| 2024 | $4,692 | $293,405 | -- | -- |
| 2023 | $4,692 | $284,859 | $0 | $0 |
| 2022 | $4,352 | $276,562 | $0 | $0 |
| 2021 | $4,461 | $268,507 | $0 | $268,507 |
| 2020 | $4,678 | $272,128 | $0 | $272,128 |
| 2019 | $4,671 | $272,935 | $0 | $272,935 |
| 2018 | $4,786 | $273,743 | $0 | $273,743 |
| 2017 | $2,756 | $163,400 | $0 | $0 |
| 2016 | $2,732 | $259,042 | $0 | $259,042 |
| 2015 | $2,748 | $251,000 | $0 | $251,000 |
| 2014 | -- | $230,800 | $0 | $230,800 |
| 2013 | -- | $191,300 | $0 | $191,300 |
Source: Public Records
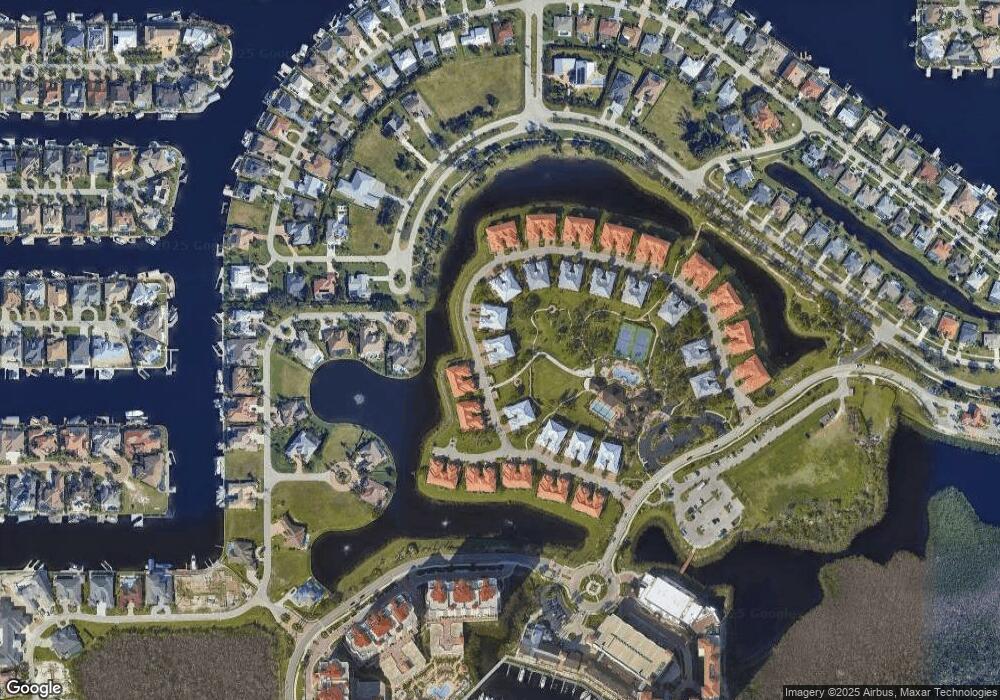
Map
Nearby Homes
- 5956 Tarpon Gardens Cir Unit 201
- 5920 Tarpon Gardens Cir Unit 201
- 6026 Tarpon Estates Ct
- 5916 Tarpon Gardens Cir Unit 202
- 1442 SW 58th Terrace
- 5912 Tarpon Gardens Cir Unit 201
- 6021 Silver King Blvd Unit 305
- 6021 Silver King Blvd Unit 302
- 6021 Silver King Blvd Unit 705
- 1444 SW 57th St
- 6061 Silver King Blvd Unit 306
- 6061 Silver King Blvd Unit 401
- 6061 Silver King Blvd Unit 705
- 6061 Silver King Blvd Unit 906
- 6061 Silver King Blvd Unit 302
- 5909 Tarpon Gardens Cir Unit 102
- 6081 Silver King Blvd Unit 501
- 6081 Silver King Blvd Unit 103
- 6081 Silver King Blvd Unit 505
- 6081 Silver King Blvd Unit 701
- 5940 Tarpon Gardens Cir Unit 202
- 5940 Tarpon Gardens Cir Unit 101
- 5940 Tarpon Gardens Cir Unit 102
- 5940 Tarpn Gardns Cir Unit 202
- 5940 Tarpn Gardns Cir Unit 201
- 5940 Tarpn Gardns Cir Unit 101
- 5936 Tarpon Gardens Cir Unit 201
- 5936 Tarpon Gardens Cir Unit 102
- 5936 Tarpn Gardns Cir Unit 202
- 5936 Tarpn Gardns Cir Unit 102
- 5936 Tarpn Gardns Cir Unit 201
- 5936 Tarpn Gardns Cir Unit 101
- 5941 Tarpn Gardns Cir Unit 101
- 5941 Tarpn Gardns Cir Unit 102
- 5941 Tarpn Gardns Cir Unit 201
- 5941 Tarpn Gardns Cir Unit 202
- 5901 Tarpon Gardens Cir Unit 202
- 5901 Tarpon Gardens Cir Unit 102
- 5901 Tarpon Gardens Cir Unit 201
- 5901 Tarpon Gardens Cir Unit 101