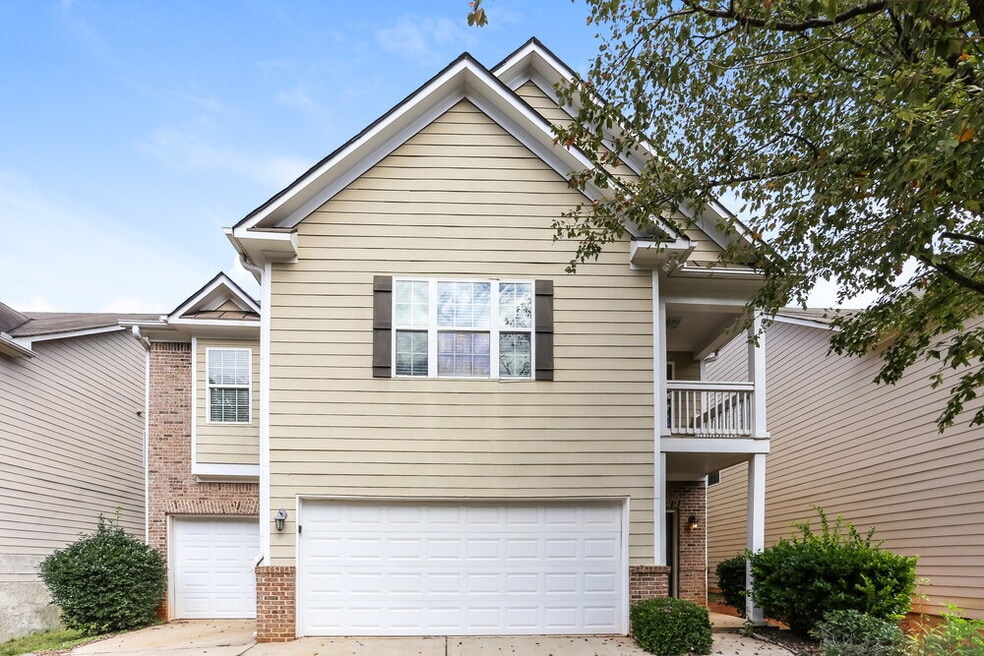
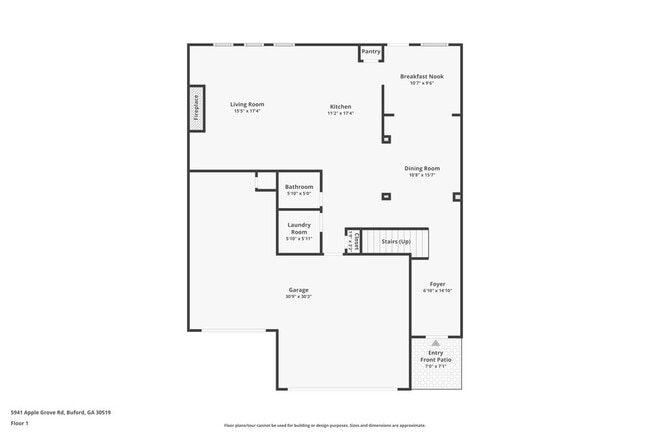
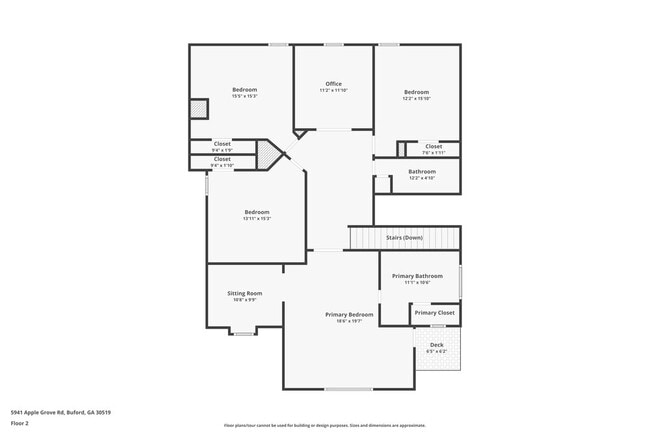
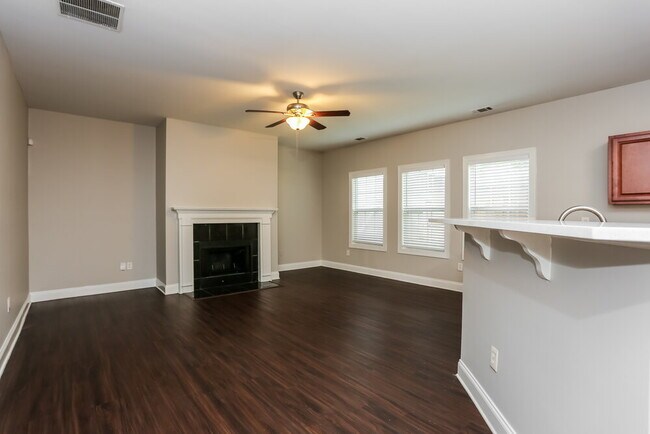
5941 Apple Grove Rd NE Buford, GA 30519
About This Home
Please note, our homes are available on a first-come, first-serve basis and are not reserved until the lease is signed by all applicants and security deposits are collected.
This home features Progress Smart Home - Progress Residential's smart home app, which allows you to control the home securely from any of your devices. Learn more at
Rent this home by November 16, 2025 and receive $500.
Want to tour on your own? Click the “Self Tour” button on this home’s listing or call to register for a self-guided showing at a time that works best for you.
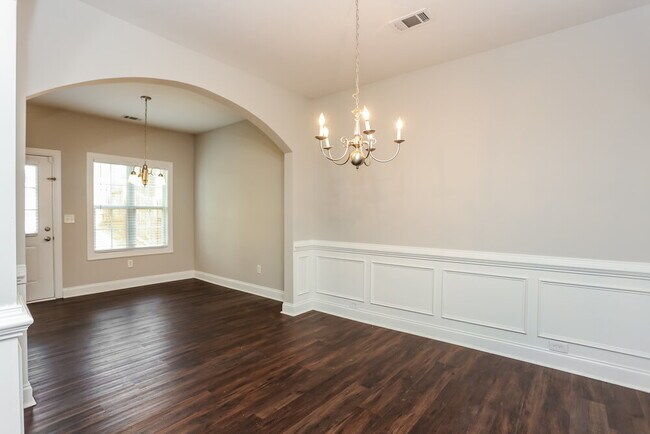
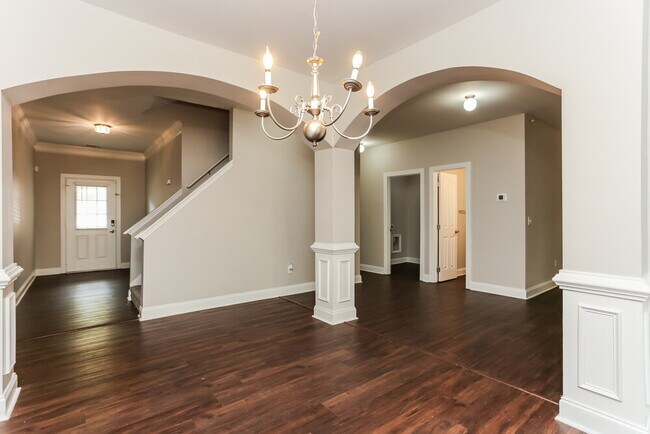
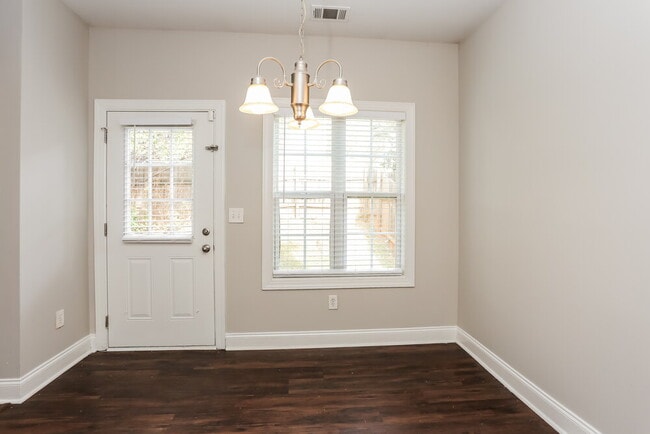
Interested in this home? You clearly have exceptional taste. This charming 4-bedroom, 2.5-bathroom home is not only pet-friendly, but also equipped with smart home features to make everyday life more convenient and connected. Homes like this don’t stay on the market for long—don’t miss your chance to make it yours. Apply today!

Map
- 5125 Cactus Cove Ln
- 6071 Apple Grove Rd
- 2046 Barberry Dr
- 2070 Cabela Dr
- 5711 Apple Grove Rd
- 4979 Lily Stem Dr
- 5586 Apple Grove Rd
- 4909 Lily Stem Dr
- 4849 Lily Stem Dr
- 4881 Bill Cheek Rd
- 2152 Andrewood Place
- 4642 Devencrest Ln Unit 1
- 4657 Water Mill Dr NE
- 2234 Grape Vine Way
- 0 Georgia 124 Unit 10590221
- 4539 Braselton Hwy
- 2264 Oak Falls Ln
- 5045 Ruby Port Rd
- 5203 Catrina Way
- 2100 Cabela Dr
- 5231 Apple Grove Rd
- 5328 Cactus Cove Ln
- 5331 Apple Grove Rd NE
- 1923 Tulip Petal Rd
- 2510 Spring Rush Dr
- 4715 Trilogy Park Trail
- 2234 Oak Falls Ln
- 2304 Grape Vine Way
- 2918 Sweet Red Cir
- 2969 Sweet Red Cir
- 4616 Waxwing St
- 1727 Holman Forest Dr NE
- 2424 Pinnae Place
- 4412 Grosbeak Dr
- 4850 Duncans Lake Dr NE
- 4642 Shay Terrace
- 2239 Bender Trail
- 4474 Well Springs Ct