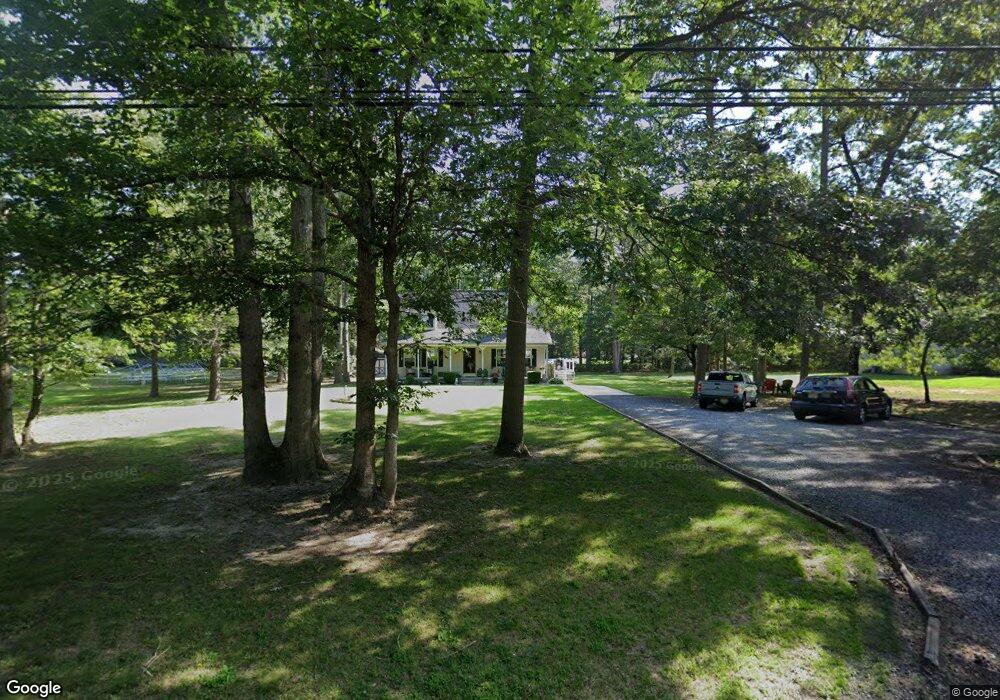
5941 Orange St Mays Landing, NJ 08330
Estimated Value: $361,319 - $412,000
--
Bed
--
Bath
1,680
Sq Ft
$228/Sq Ft
Est. Value
About This Home
This home is located at 5941 Orange St, Mays Landing, NJ 08330 and is currently estimated at $383,580, approximately $228 per square foot. 5941 Orange St is a home located in Atlantic County with nearby schools including Joseph Shaner School, George L. Hess Educational Complex, and William Davies Middle School.
Ownership History
Date
Name
Owned For
Owner Type
Purchase Details
Closed on
Apr 28, 1995
Sold by
Dililah Oaks Construction Co Inc
Bought by
Colquhoun John William and Colquhoun Catherine
Current Estimated Value
Purchase Details
Closed on
Dec 30, 1994
Sold by
Leonetti Sam
Bought by
Delilah Oaks Construction Co Inc
Purchase Details
Closed on
Apr 15, 1989
Sold by
Salomone Philip and Salomone Marie J
Bought by
Leonetti Sam
Create a Home Valuation Report for This Property
The Home Valuation Report is an in-depth analysis detailing your home's value as well as a comparison with similar homes in the area
Home Values in the Area
Average Home Value in this Area
Purchase History
| Date | Buyer | Sale Price | Title Company |
|---|---|---|---|
| Colquhoun John William | $118,000 | The Title Company | |
| Delilah Oaks Construction Co Inc | $27,900 | The Title Company Of Jersey | |
| Leonetti Sam | $22,000 | -- |
Source: Public Records
Tax History Compared to Growth
Tax History
| Year | Tax Paid | Tax Assessment Tax Assessment Total Assessment is a certain percentage of the fair market value that is determined by local assessors to be the total taxable value of land and additions on the property. | Land | Improvement |
|---|---|---|---|---|
| 2025 | $6,498 | $189,400 | $39,600 | $149,800 |
| 2024 | $6,498 | $189,400 | $39,600 | $149,800 |
| 2023 | $6,110 | $189,400 | $39,600 | $149,800 |
| 2022 | $6,110 | $189,400 | $39,600 | $149,800 |
| 2021 | $6,097 | $189,400 | $39,600 | $149,800 |
| 2020 | $6,097 | $189,400 | $39,600 | $149,800 |
| 2019 | $6,112 | $189,400 | $39,600 | $149,800 |
| 2018 | $5,898 | $189,400 | $39,600 | $149,800 |
| 2017 | $5,805 | $189,400 | $39,600 | $149,800 |
| 2016 | $5,642 | $189,400 | $39,600 | $149,800 |
| 2015 | $5,451 | $189,400 | $39,600 | $149,800 |
| 2014 | $5,866 | $223,300 | $44,600 | $178,700 |
Source: Public Records
Map
Nearby Homes