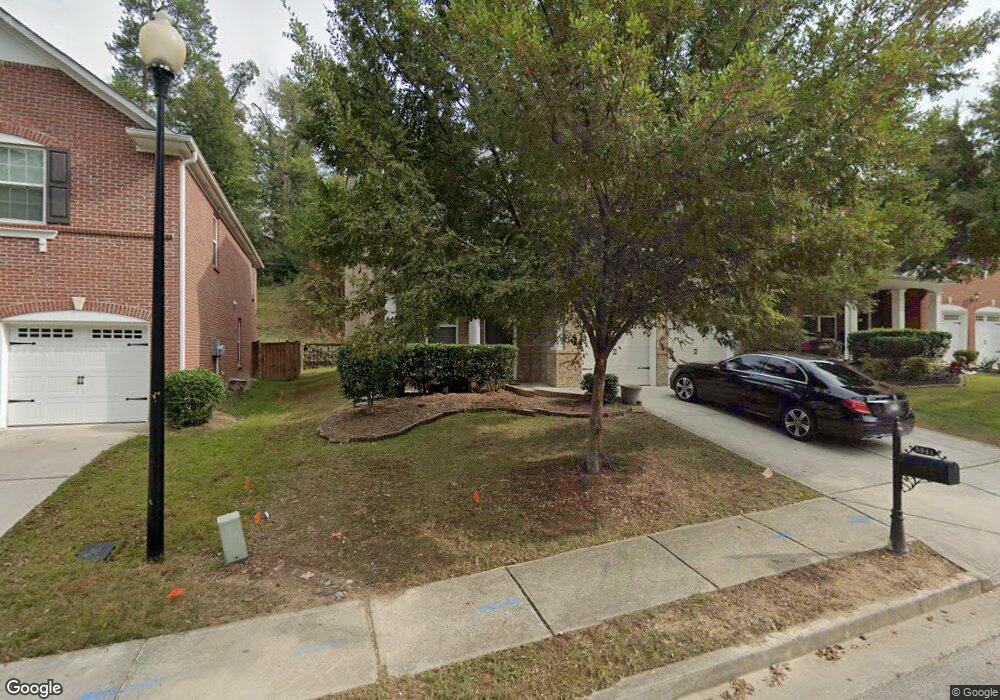
5941 Sharp Dr SE Mableton, GA 30126
Estimated Value: $482,000 - $496,000
4
Beds
3
Baths
3,102
Sq Ft
$158/Sq Ft
Est. Value
About This Home
This home is located at 5941 Sharp Dr SE, Mableton, GA 30126 and is currently estimated at $488,772, approximately $157 per square foot. 5941 Sharp Dr SE is a home located in Cobb County with nearby schools including Clay-Harmony Leland Elementary School, Lindley Middle School, and Pebblebrook High School.
Ownership History
Date
Name
Owned For
Owner Type
Purchase Details
Closed on
Jun 17, 2021
Sold by
Woubshet Paula Watkis and Watkis Paula
Bought by
Tran Maggie Neocle and Geeter Kelley
Current Estimated Value
Home Financials for this Owner
Home Financials are based on the most recent Mortgage that was taken out on this home.
Original Mortgage
$370,500
Outstanding Balance
$334,710
Interest Rate
2.9%
Mortgage Type
New Conventional
Estimated Equity
$154,062
Purchase Details
Closed on
Jun 15, 2021
Sold by
Watkis Veronica
Bought by
Woubshet Paula Watkis
Home Financials for this Owner
Home Financials are based on the most recent Mortgage that was taken out on this home.
Original Mortgage
$370,500
Outstanding Balance
$334,710
Interest Rate
2.9%
Mortgage Type
New Conventional
Estimated Equity
$154,062
Purchase Details
Closed on
Jan 16, 2008
Sold by
Watkis Paula A
Bought by
Watkis Paula A and Watkis Veronica
Purchase Details
Closed on
Nov 9, 2007
Sold by
Kb Hm Atl Llc
Bought by
Watkis Paula A
Home Financials for this Owner
Home Financials are based on the most recent Mortgage that was taken out on this home.
Original Mortgage
$130,000
Interest Rate
6.26%
Mortgage Type
New Conventional
Create a Home Valuation Report for This Property
The Home Valuation Report is an in-depth analysis detailing your home's value as well as a comparison with similar homes in the area
Home Values in the Area
Average Home Value in this Area
Purchase History
| Date | Buyer | Sale Price | Title Company |
|---|---|---|---|
| Tran Maggie Neocle | $390,000 | None Available | |
| Woubshet Paula Watkis | -- | None Available | |
| Watkis Paula A | -- | -- | |
| Watkis Paula A | $255,000 | -- |
Source: Public Records
Mortgage History
| Date | Status | Borrower | Loan Amount |
|---|---|---|---|
| Open | Tran Maggie Neocle | $370,500 | |
| Previous Owner | Watkis Paula A | $130,000 |
Source: Public Records
Tax History
| Year | Tax Paid | Tax Assessment Tax Assessment Total Assessment is a certain percentage of the fair market value that is determined by local assessors to be the total taxable value of land and additions on the property. | Land | Improvement |
|---|---|---|---|---|
| 2025 | $4,946 | $217,652 | $36,000 | $181,652 |
| 2024 | $4,946 | $217,652 | $36,000 | $181,652 |
| 2023 | $3,233 | $152,208 | $22,000 | $130,208 |
Source: Public Records
Map
Nearby Homes
- 1507 Justine Way SE
- 5942 Enclave Dr SE
- 5943 Enclave Dr SE
- 6208 Pipevine Ln SE
- 6150 Indian Wood Cir SE
- 5921 Brookside Dr SE
- 1736 Dickerson Dr SE
- 5800 Oakdale Rd SE Unit 118
- 5800 Oakdale Rd SE Unit 158
- 1629 Flint River Place SE
- 6141 Ogeechee Rd SE
- 6117 Ogeechee Rd SE
- 1643 Coasta Way SE
- 1444 Ridgebend Way SE
- 6255 Oakdale Rd SE
- 1452 Ridgebend Way SE
- 6312 Brookwater View SE
- 6500 Brooklake Ct SE
- 1653 Fair Oak Way
- 1781 Corley Dr
- 5941 Sharp Dr SE
- 5943 Sharp Dr SE Unit 21
- 5943 Sharp Dr SE
- 5939 Sharp Dr SE
- 5945 Sharp Dr SE
- 6010 Oakdale Rd SE
- 5935 Sharp Dr SE
- 6026 Oakdale Rd SE
- 5947 Sharp Dr
- 5947 Sharp Dr SE
- 5933 Sharp Dr SE
- 5934 Sharp Dr SE
- 5936 Sharp Dr SE
- 5932 Sharp Dr SE Unit 5932
- 5932 Sharp Dr SE
- 5932 Sharp Dr SE
- 5861 Farmlake Ct SE
- 5929 Sharp Dr SE
- 5930 Sharp Dr SE
- 5927 Sharp Dr SE
Your Personal Tour Guide
Ask me questions while you tour the home.