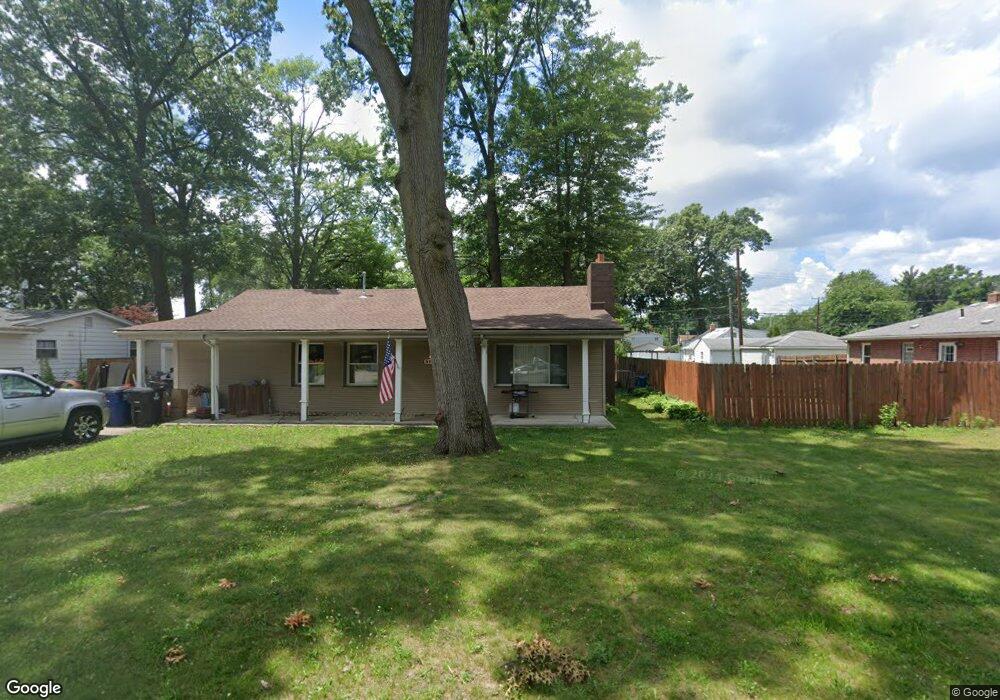
5943 N Harvey St Westland, MI 48185
Estimated Value: $199,000 - $222,000
--
Bed
1
Bath
1,288
Sq Ft
$163/Sq Ft
Est. Value
About This Home
This home is located at 5943 N Harvey St, Westland, MI 48185 and is currently estimated at $210,464, approximately $163 per square foot. 5943 N Harvey St is a home located in Wayne County with nearby schools including Wildwood Elementary School, Marshall Upper Elementary School, and Adlai Stevenson Middle School.
Ownership History
Date
Name
Owned For
Owner Type
Purchase Details
Closed on
Feb 19, 2014
Sold by
Hall Corey D and Hall Danyelle L
Bought by
Hall Corey D and Hall Danyelle L
Current Estimated Value
Home Financials for this Owner
Home Financials are based on the most recent Mortgage that was taken out on this home.
Original Mortgage
$113,735
Outstanding Balance
$73,612
Interest Rate
4.62%
Mortgage Type
FHA
Estimated Equity
$136,852
Purchase Details
Closed on
Sep 21, 2007
Sold by
Nelson Brian and Nelson Cheryl
Bought by
Hall Corey D
Purchase Details
Closed on
Mar 30, 2007
Sold by
Fannie Mae
Bought by
Nelson Brian and Nelson Cheryl
Purchase Details
Closed on
May 2, 2006
Sold by
Mortgage Electronic Registration Systems
Bought by
Federal National Mortgage Association
Purchase Details
Closed on
Mar 23, 2006
Sold by
Carmickle Shannon M
Bought by
Mortgage Electronic Registration Systems
Purchase Details
Closed on
Jun 29, 2005
Sold by
Sabri Ammar and Sabri Anita N
Bought by
Carmickle Shannon M
Purchase Details
Closed on
Sep 3, 1997
Sold by
Alice F Jorge
Bought by
Christopher M Perkins
Create a Home Valuation Report for This Property
The Home Valuation Report is an in-depth analysis detailing your home's value as well as a comparison with similar homes in the area
Home Values in the Area
Average Home Value in this Area
Purchase History
| Date | Buyer | Sale Price | Title Company |
|---|---|---|---|
| Hall Corey D | -- | None Available | |
| Hall Corey D | $130,000 | Multiple | |
| Nelson Brian | $63,000 | Greco | |
| Federal National Mortgage Association | -- | Parks Title | |
| Mortgage Electronic Registration Systems | $136,072 | None Available | |
| Carmickle Shannon M | $131,000 | Multiple | |
| Christopher M Perkins | $45,000 | -- |
Source: Public Records
Mortgage History
| Date | Status | Borrower | Loan Amount |
|---|---|---|---|
| Open | Hall Corey D | $113,735 |
Source: Public Records
Tax History Compared to Growth
Tax History
| Year | Tax Paid | Tax Assessment Tax Assessment Total Assessment is a certain percentage of the fair market value that is determined by local assessors to be the total taxable value of land and additions on the property. | Land | Improvement |
|---|---|---|---|---|
| 2025 | $1,962 | $96,200 | $0 | $0 |
| 2024 | $1,962 | $93,800 | $0 | $0 |
| 2023 | $1,874 | $84,300 | $0 | $0 |
| 2022 | $2,133 | $75,600 | $0 | $0 |
| 2021 | $2,079 | $70,300 | $0 | $0 |
| 2020 | $2,057 | $60,200 | $0 | $0 |
| 2019 | $1,981 | $55,800 | $0 | $0 |
| 2018 | $1,542 | $47,200 | $0 | $0 |
| 2017 | $640 | $44,100 | $0 | $0 |
| 2016 | $1,929 | $42,500 | $0 | $0 |
| 2015 | $3,804 | $38,640 | $0 | $0 |
| 2013 | $3,890 | $39,080 | $0 | $0 |
| 2012 | $1,840 | $43,680 | $0 | $0 |
Source: Public Records
Map
Nearby Homes
- 35754 Castlewood Ct
- 35737 Hunter Ave
- 6546 Quail Run Cir
- 0 N Wayne Rd
- 7051 Wayne Rd
- 35863 Hunter Ave Unit 34
- 35833 Ford Rd
- 34802 Pardo St
- 34752 John Hauk St
- 0 Dowling Ave
- 1654 Shoemaker Dr Unit 145
- 6145 N Dowling St
- 1680 N Hanlon St
- 1605 N Hanlon St
- 6541 Pembrook Dr
- 1309 Shoemaker Dr
- 34203 Tomahawk Dr
- 6026 Wilmer St
- 37186 Amhurst Dr Unit 5
- 5692 N Globe St
- 5919 N Harvey St
- 5973 N Harvey St
- 5924 N Parent St Unit Bldg-Unit
- 5924 N Parent St
- 5948 N Parent St
- 5900 N Parent St
- 5972 N Parent St
- 5942 N Harvey St
- 5900 N Harvey St
- 5900 N Harvey St
- 5877 N Harvey St
- 5882 N Parent St
- 5960 N Harvey St
- 6001 N Harvey St
- 5888 N Harvey St
- 6015 N Harvey St
- 5858 N Parent St
- 5863 N Harvey St
- 6006 N Harvey St
- 6006 N Parent St