Estimated Value: $350,000 - $386,000
2
Beds
1
Bath
1,348
Sq Ft
$271/Sq Ft
Est. Value
About This Home
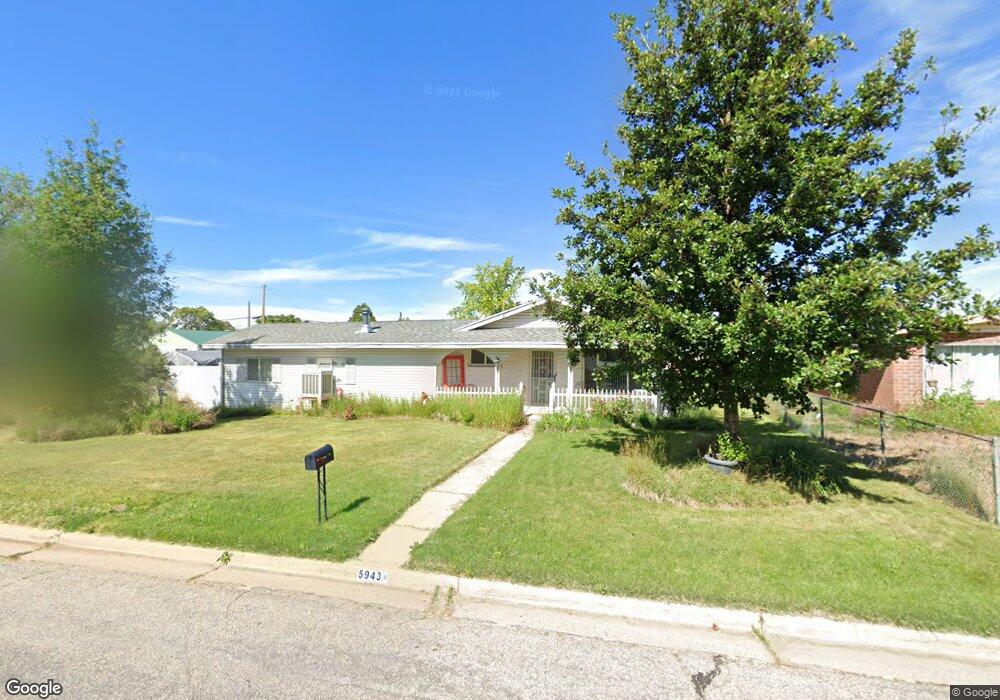
This home is located at 5943 S 2575 W, Roy, UT 84067 and is currently estimated at $365,780, approximately $271 per square foot. 5943 S 2575 W is a home located in Weber County with nearby schools including Municipal School, Roy Junior High School, and Roy High School.
Ownership History
Date
Name
Owned For
Owner Type
Purchase Details
Closed on
Nov 1, 2010
Sold by
Naylor Tamra J
Bought by
Naylor Eric S and Naylor Tamra J
Current Estimated Value
Home Financials for this Owner
Home Financials are based on the most recent Mortgage that was taken out on this home.
Original Mortgage
$109,888
Outstanding Balance
$76,034
Interest Rate
5.25%
Mortgage Type
FHA
Estimated Equity
$289,746
Purchase Details
Closed on
Jul 1, 2008
Sold by
Sowerby Llryne
Bought by
Naylor Eric S and Naylor Tamra J
Create a Home Valuation Report for This Property
The Home Valuation Report is an in-depth analysis detailing your home's value as well as a comparison with similar homes in the area
Home Values in the Area
Average Home Value in this Area
Purchase History
| Date | Buyer | Sale Price | Title Company |
|---|---|---|---|
| Naylor Eric S | -- | Mountain View Title Ogden | |
| Naylor Tamra J | -- | Mountain View Title Ogden | |
| Naylor Eric S | -- | Accommodation |
Source: Public Records
Mortgage History
| Date | Status | Borrower | Loan Amount |
|---|---|---|---|
| Open | Naylor Tamra J | $109,888 |
Source: Public Records
Tax History
| Year | Tax Paid | Tax Assessment Tax Assessment Total Assessment is a certain percentage of the fair market value that is determined by local assessors to be the total taxable value of land and additions on the property. | Land | Improvement |
|---|---|---|---|---|
| 2025 | $2,063 | $317,178 | $110,000 | $207,178 |
| 2024 | $1,998 | $169,949 | $60,509 | $109,440 |
| 2023 | $1,869 | $158,400 | $57,745 | $100,655 |
| 2022 | $2,142 | $190,850 | $55,008 | $135,842 |
| 2021 | $1,611 | $232,000 | $65,022 | $166,978 |
| 2020 | $1,524 | $202,000 | $65,022 | $136,978 |
| 2019 | $1,456 | $181,000 | $40,002 | $140,998 |
| 2018 | $1,300 | $150,000 | $35,083 | $114,917 |
| 2017 | $1,235 | $133,000 | $35,083 | $97,917 |
| 2016 | $1,145 | $65,710 | $19,237 | $46,473 |
| 2015 | $1,097 | $64,499 | $21,944 | $42,555 |
| 2014 | $1,106 | $64,500 | $16,499 | $48,001 |
Source: Public Records
Map
Nearby Homes
Your Personal Tour Guide
Ask me questions while you tour the home.