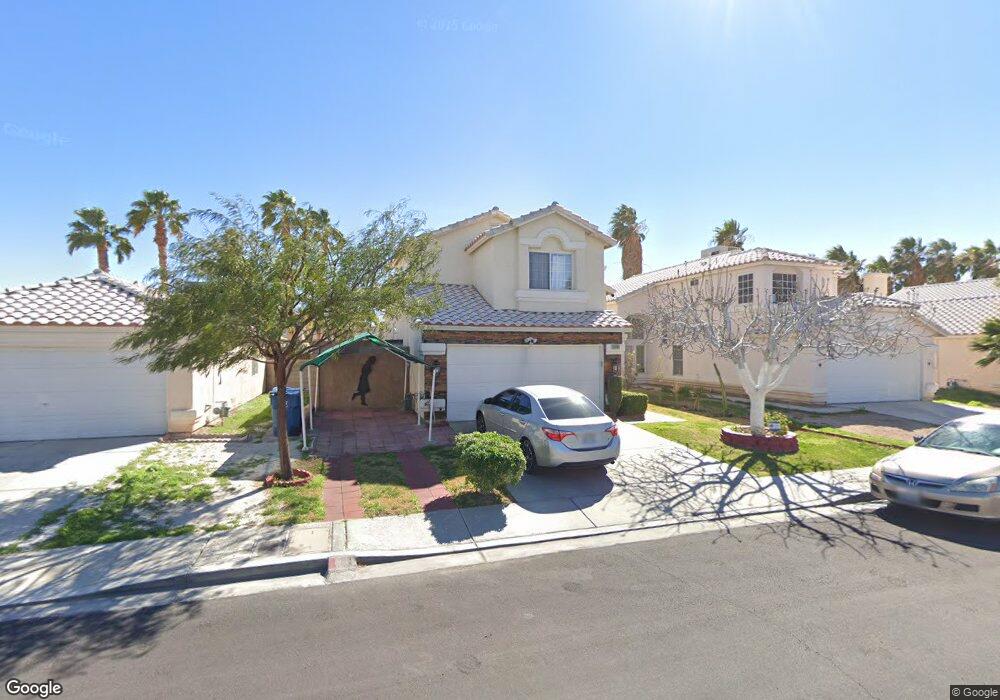
5943 Wabusca Way Las Vegas, NV 89142
Estimated Value: $368,000 - $383,231
3
Beds
3
Baths
1,422
Sq Ft
$266/Sq Ft
Est. Value
About This Home
This home is located at 5943 Wabusca Way, Las Vegas, NV 89142 and is currently estimated at $378,308, approximately $266 per square foot. 5943 Wabusca Way is a home located in Clark County with nearby schools including John F. Mendoza Elementary School, Duane D. Keller Middle School, and Las Vegas High School.
Ownership History
Date
Name
Owned For
Owner Type
Purchase Details
Closed on
Sep 19, 2002
Sold by
Spach Chris P and Spach Joanne L
Bought by
Perez Lorenzo Antonio and Perez Maria Teresa
Current Estimated Value
Home Financials for this Owner
Home Financials are based on the most recent Mortgage that was taken out on this home.
Original Mortgage
$150,350
Outstanding Balance
$62,440
Interest Rate
6.16%
Estimated Equity
$315,868
Purchase Details
Closed on
Sep 25, 2000
Sold by
Spach Joanne L
Bought by
Spach Chris P
Home Financials for this Owner
Home Financials are based on the most recent Mortgage that was taken out on this home.
Original Mortgage
$37,600
Interest Rate
7.98%
Mortgage Type
Stand Alone Second
Purchase Details
Closed on
Jul 18, 1995
Sold by
Pacific Homes
Bought by
Spach Chris P and Spach Joanne L
Home Financials for this Owner
Home Financials are based on the most recent Mortgage that was taken out on this home.
Original Mortgage
$108,487
Interest Rate
7.59%
Mortgage Type
FHA
Create a Home Valuation Report for This Property
The Home Valuation Report is an in-depth analysis detailing your home's value as well as a comparison with similar homes in the area
Home Values in the Area
Average Home Value in this Area
Purchase History
| Date | Buyer | Sale Price | Title Company |
|---|---|---|---|
| Perez Lorenzo Antonio | $155,000 | United Title | |
| Spach Chris P | -- | United Title | |
| Spach Chris P | -- | -- | |
| Spach Chris P | $110,000 | Nevada Title Company |
Source: Public Records
Mortgage History
| Date | Status | Borrower | Loan Amount |
|---|---|---|---|
| Open | Perez Lorenzo Antonio | $150,350 | |
| Previous Owner | Spach Chris P | $37,600 | |
| Previous Owner | Spach Chris P | $108,487 |
Source: Public Records
Tax History Compared to Growth
Tax History
| Year | Tax Paid | Tax Assessment Tax Assessment Total Assessment is a certain percentage of the fair market value that is determined by local assessors to be the total taxable value of land and additions on the property. | Land | Improvement |
|---|---|---|---|---|
| 2025 | $1,227 | $86,079 | $22,750 | $63,329 |
| 2024 | $1,192 | $86,079 | $22,750 | $63,329 |
| 2023 | $972 | $86,167 | $26,250 | $59,917 |
| 2022 | $1,157 | $76,931 | $21,700 | $55,231 |
| 2021 | $1,124 | $72,579 | $19,950 | $52,629 |
| 2020 | $1,088 | $71,276 | $18,900 | $52,376 |
| 2019 | $1,056 | $67,789 | $16,100 | $51,689 |
| 2018 | $1,026 | $63,181 | $13,300 | $49,881 |
| 2017 | $972 | $60,585 | $9,800 | $50,785 |
| 2016 | $972 | $54,173 | $8,400 | $45,773 |
| 2015 | $970 | $39,460 | $5,600 | $33,860 |
| 2014 | $941 | $31,749 | $5,250 | $26,499 |
Source: Public Records
Map
Nearby Homes
- 2307 Tuscarora Ct
- 6028 Las Nubes Dr
- 2179 Raspberry Hill Rd
- 6080 Saint Petersburg Dr
- 1950 Turtlerock St
- 6131 Pumpkin Patch Ave
- 6170 E Sahara Ave Unit 1031
- 6170 E Sahara Ave Unit 1076
- 6170 E Sahara Ave Unit 1111
- 5857 Rainbow Bridge Dr
- 6105 E Sahara Ave Unit 35
- 6105 E Sahara Ave Unit 117
- 6105 E Sahara Ave Unit 166
- 6105 E Sahara Ave Unit 26
- 1927 Raspberry Hill Rd
- 5816 Glory Canyon Way
- 5926 Mahogany Mountain Dr
- 5650 E Sahara Ave Unit 2010
- 5650 E Sahara Ave Unit 2007
- 5650 E Sahara Ave Unit 1035
- 5937 Wabusca Way
- 5949 Wabusca Way
- 5931 Wabusca Way
- 5938 Woodfield Dr
- 5944 Woodfield Dr
- 5932 Woodfield Dr
- 5925 Wabusca Way
- 5926 Woodfield Dr
- 5936 Wabusca Way
- 5942 Wabusca Way
- 5930 Wabusca Way
- 5948 Wabusca Way
- 2322 Millett Dr
- 5920 Woodfield Dr
- 2312 Millett Dr
- 5919 Wabusca Way
- 2332 Millett Dr
- 5924 Wabusca Way
- 2342 Millett Dr
- 5914 Woodfield Dr