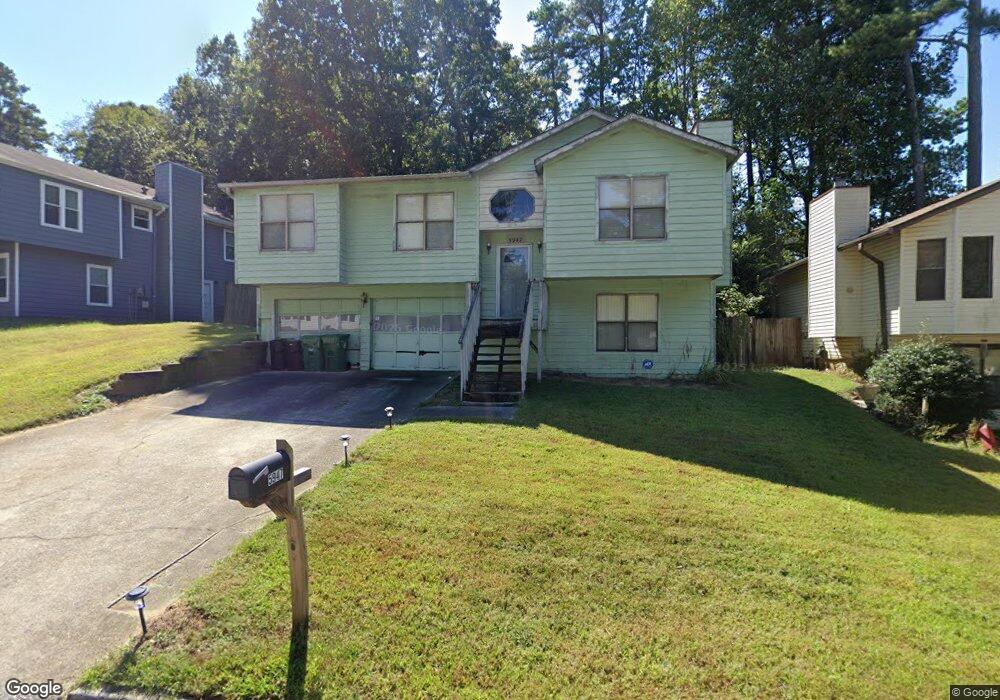
5947 Wellborn Trail Lithonia, GA 30058
Estimated Value: $217,000 - $254,000
3
Beds
2
Baths
1,698
Sq Ft
$135/Sq Ft
Est. Value
About This Home
This home is located at 5947 Wellborn Trail, Lithonia, GA 30058 and is currently estimated at $228,629, approximately $134 per square foot. 5947 Wellborn Trail is a home located in DeKalb County with nearby schools including Panola Way Elementary School, Lithonia Middle School, and Lithonia High School.
Ownership History
Date
Name
Owned For
Owner Type
Purchase Details
Closed on
May 5, 2010
Sold by
Hud-Housing Of Urban Dev
Bought by
Owens Don C and Weather-Owens Angela
Current Estimated Value
Purchase Details
Closed on
Sep 1, 2009
Sold by
National Cty Bk
Bought by
Hud-Housing Of Urban Dev
Purchase Details
Closed on
Jun 25, 2001
Sold by
Daniels John D and Daniels Cynthia
Bought by
Daniels John T and Daniels Cynthia L
Home Financials for this Owner
Home Financials are based on the most recent Mortgage that was taken out on this home.
Original Mortgage
$99,216
Interest Rate
7.17%
Mortgage Type
Stand Alone Refi Refinance Of Original Loan
Purchase Details
Closed on
Jan 31, 2000
Sold by
Rivers Tracy L and Rivers Connie S
Bought by
Hippolyte Monette D
Home Financials for this Owner
Home Financials are based on the most recent Mortgage that was taken out on this home.
Original Mortgage
$96,505
Interest Rate
8.02%
Mortgage Type
FHA
Create a Home Valuation Report for This Property
The Home Valuation Report is an in-depth analysis detailing your home's value as well as a comparison with similar homes in the area
Home Values in the Area
Average Home Value in this Area
Purchase History
| Date | Buyer | Sale Price | Title Company |
|---|---|---|---|
| Owens Don C | -- | -- | |
| Hud-Housing Of Urban Dev | -- | -- | |
| National Cty Bk | $101,305 | -- | |
| Daniels John T | -- | -- | |
| Hippolyte Monette D | $97,300 | -- |
Source: Public Records
Mortgage History
| Date | Status | Borrower | Loan Amount |
|---|---|---|---|
| Previous Owner | Daniels John T | $99,216 | |
| Previous Owner | Hippolyte Monette D | $96,505 |
Source: Public Records
Tax History Compared to Growth
Tax History
| Year | Tax Paid | Tax Assessment Tax Assessment Total Assessment is a certain percentage of the fair market value that is determined by local assessors to be the total taxable value of land and additions on the property. | Land | Improvement |
|---|---|---|---|---|
| 2025 | $2,472 | $90,200 | $15,000 | $75,200 |
| 2024 | $2,556 | $91,920 | $15,000 | $76,920 |
| 2023 | $2,556 | $88,720 | $15,000 | $73,720 |
| 2022 | $2,177 | $78,880 | $15,000 | $63,880 |
| 2021 | $1,760 | $60,800 | $7,200 | $53,600 |
| 2020 | $1,449 | $47,120 | $7,200 | $39,920 |
| 2019 | $1,380 | $44,680 | $7,200 | $37,480 |
| 2018 | $1,103 | $41,880 | $7,200 | $34,680 |
| 2017 | $1,294 | $38,240 | $3,640 | $34,600 |
| 2016 | $798 | $25,600 | $3,640 | $21,960 |
| 2014 | $754 | $24,200 | $3,640 | $20,560 |
Source: Public Records
Map
Nearby Homes
- 2202 Lowtrail Ct
- 2218 Lowtrail Ct
- 5876 Old Wellborn Trace
- 2284 Cypress Point Way
- 2158 Sara Ashley Way
- 2138 Tiffany Trail
- 2169 Tiffany Ln
- 5822 Cedar Croft Ln
- Pearson Plan at Wellington Park
- 5812 Wind Gate Ln
- 2237 Wind Rose Ct
- 2335 Haran Dr
- 2335 Haran Dr Unit 51
- 2337 Haran Dr Unit 50
- 2337 Haran Dr
- 2128 Tiffany Ln
- 2339 Haran Dr Unit 49
- 2339 Haran Dr
- 2341 Haran Dr Unit 48
- 2341 Haran Dr
- 5953 Wellborn Trail
- 0 Wellborn Trail Unit 8557290
- 0 Wellborn Trail Unit 8350121
- 0 Wellborn Trail Unit 7089098
- 0 Wellborn Trail Unit 8922777
- 0 Wellborn Trail Unit 7031564
- 0 Wellborn Trail Unit 7248844
- 0 Wellborn Trail
- 5943 Wellborn Trail
- 2219 Cody Ct
- 5957 Wellborn Trail
- 2223 Cody Ct
- 2218 Cody Ct
- 5937 Wellborn Trail
- 5944 Wellborn Trail
- 5948 Wellborn Trail
- 5952 Wellborn Trail
- 5938 Wellborn Trail
- 5961 Wellborn Trail Unit 30
- 5961 Wellborn Trail