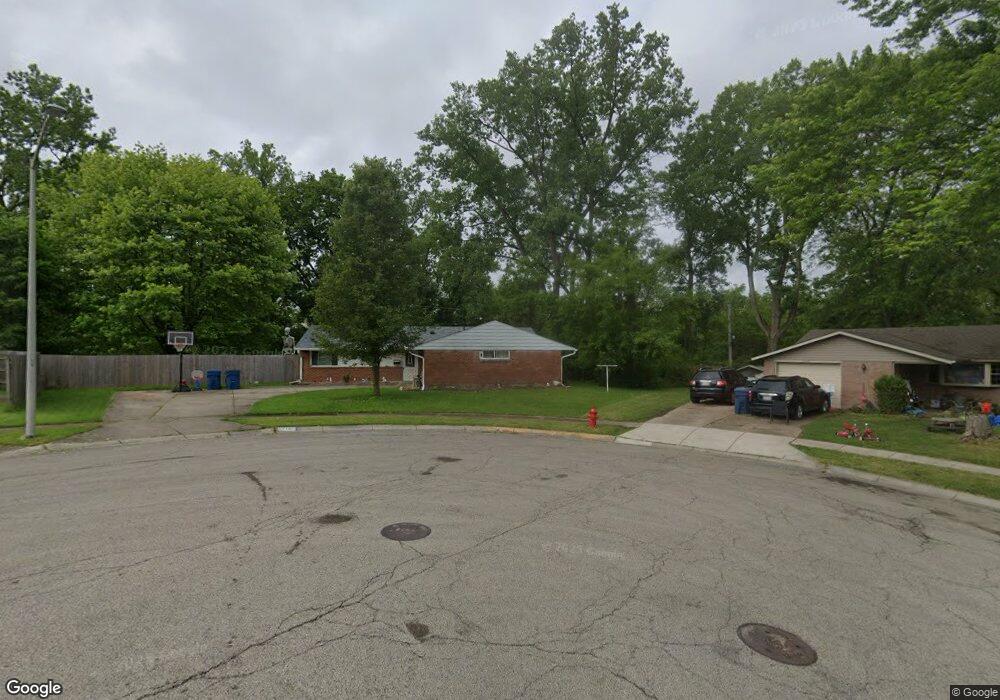
5948 Leycross Dr Dayton, OH 45424
Estimated Value: $202,000 - $221,000
4
Beds
2
Baths
1,404
Sq Ft
$151/Sq Ft
Est. Value
About This Home
This home is located at 5948 Leycross Dr, Dayton, OH 45424 and is currently estimated at $212,365, approximately $151 per square foot. 5948 Leycross Dr is a home located in Montgomery County with nearby schools including Wayne High School and Huber Heights Christian Academy.
Ownership History
Date
Name
Owned For
Owner Type
Purchase Details
Closed on
Apr 7, 2022
Sold by
Floyd Robert
Bought by
Floyd Robert and Floyd Anna L
Current Estimated Value
Home Financials for this Owner
Home Financials are based on the most recent Mortgage that was taken out on this home.
Original Mortgage
$116,000
Outstanding Balance
$101,930
Interest Rate
3.85%
Mortgage Type
New Conventional
Estimated Equity
$110,435
Purchase Details
Closed on
Jun 19, 2014
Sold by
Leonard Leslie J
Bought by
Floyd Robert
Home Financials for this Owner
Home Financials are based on the most recent Mortgage that was taken out on this home.
Original Mortgage
$79,517
Interest Rate
4.37%
Mortgage Type
FHA
Purchase Details
Closed on
Oct 23, 2009
Sold by
Frye Patricia A
Bought by
Frye Patricia A and Leonard Leslie J
Purchase Details
Closed on
Feb 13, 2009
Sold by
Frye Patricia A
Bought by
Frye Patricia A
Purchase Details
Closed on
Oct 18, 2005
Sold by
Frye Patricia A and Haynes John F
Bought by
Frye Patricia A and Haynes John F
Create a Home Valuation Report for This Property
The Home Valuation Report is an in-depth analysis detailing your home's value as well as a comparison with similar homes in the area
Home Values in the Area
Average Home Value in this Area
Purchase History
| Date | Buyer | Sale Price | Title Company |
|---|---|---|---|
| Floyd Robert | -- | None Listed On Document | |
| Floyd Robert | $81,000 | Midwest Title Co | |
| Frye Patricia A | -- | Attorney | |
| Frye Patricia A | -- | Attorney | |
| Frye Patricia A | -- | Attorney |
Source: Public Records
Mortgage History
| Date | Status | Borrower | Loan Amount |
|---|---|---|---|
| Open | Floyd Robert | $116,000 | |
| Previous Owner | Floyd Robert | $79,517 |
Source: Public Records
Tax History Compared to Growth
Tax History
| Year | Tax Paid | Tax Assessment Tax Assessment Total Assessment is a certain percentage of the fair market value that is determined by local assessors to be the total taxable value of land and additions on the property. | Land | Improvement |
|---|---|---|---|---|
| 2024 | $2,624 | $50,790 | $10,150 | $40,640 |
| 2023 | $2,624 | $50,790 | $10,150 | $40,640 |
| 2022 | $2,349 | $34,990 | $7,000 | $27,990 |
| 2021 | $2,388 | $34,990 | $7,000 | $27,990 |
| 2020 | $2,390 | $34,990 | $7,000 | $27,990 |
| 2019 | $2,345 | $30,360 | $7,000 | $23,360 |
| 2018 | $2,353 | $30,360 | $7,000 | $23,360 |
| 2017 | $2,339 | $30,360 | $7,000 | $23,360 |
| 2016 | $2,225 | $28,110 | $7,000 | $21,110 |
| 2015 | $2,138 | $28,110 | $7,000 | $21,110 |
| 2014 | $2,138 | $28,110 | $7,000 | $21,110 |
| 2012 | -- | $30,420 | $9,630 | $20,790 |
Source: Public Records
Map
Nearby Homes
- 6529 Harshmanville Rd
- 7126 Mandrake Dr
- 6673 Celestine St
- 6800 Cicero Ct
- 5904 Troy Villa Blvd Unit 20051
- 6245 Longford Rd
- 7150 Harshmanville Rd
- 5926 Chambersburg Rd
- 5631 Longford Rd
- 5637 Troy Villa Blvd Unit 20088
- 5873 Troy Villa Blvd Unit 20174
- 5248 Tilbury Rd
- 5625 Copley Cir
- 6946 Hubbard Dr
- 6413 Alter Rd
- 5135 Chesham Dr
- 6601 Grovehill Dr
- 7371 Damascus Dr
- 6717 Alter Rd
- 6447 Highbury Rd
- 5956 Leycross Dr
- 5940 Leycross Dr
- 6741 Hubbard Dr
- 6735 Hubbard Dr
- 1063 Claybeck Dr
- 6749 Hubbard Dr
- 5964 Leycross Dr
- 5947 Leycross Dr
- 6757 Hubbard Dr
- 6729 Hubbard Dr
- 5955 Leycross Dr
- 5972 Leycross Dr
- 6763 Hubbard Dr
- 6034 Longford Rd
- 6042 Longford Rd
- 5963 Leycross Dr
- 6026 Longford Rd
- 6721 Hubbard Dr
- 6050 Longford Rd
- 6738 Hubbard Dr