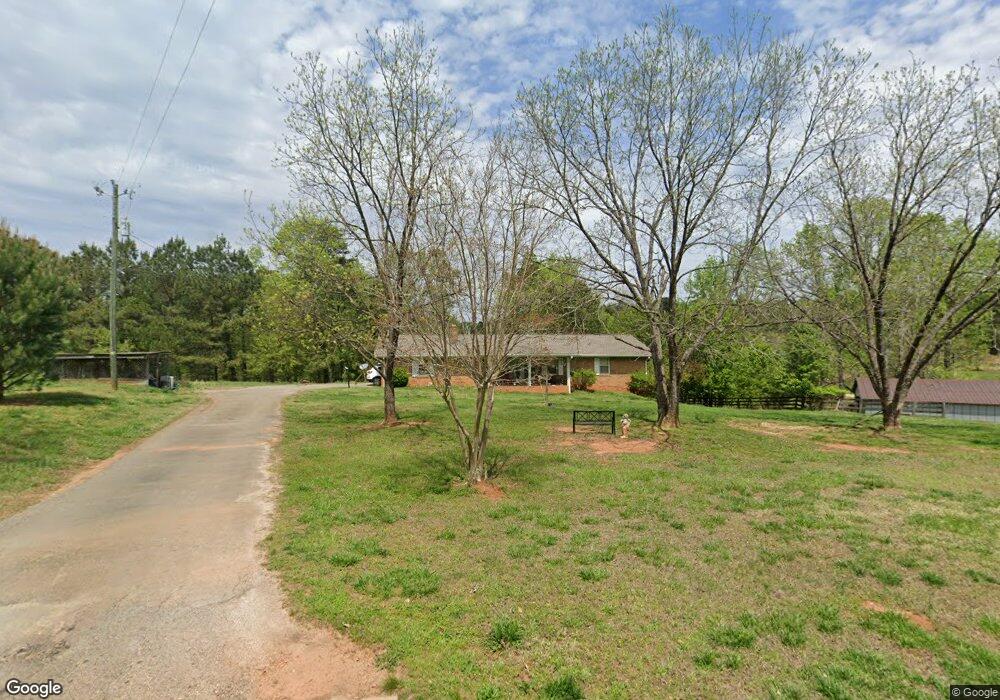
5948 Overby Rd Flowery Branch, GA 30542
Estimated Value: $310,513 - $388,000
3
Beds
2
Baths
2,100
Sq Ft
$159/Sq Ft
Est. Value
About This Home
This home is located at 5948 Overby Rd, Flowery Branch, GA 30542 and is currently estimated at $333,628, approximately $158 per square foot. 5948 Overby Rd is a home located in Hall County with nearby schools including Flowery Branch Elementary School, West Hall Middle School, and West Hall High School.
Ownership History
Date
Name
Owned For
Owner Type
Purchase Details
Closed on
Jul 18, 2011
Sold by
Federal National Mortgage Asso
Bought by
Morgan Duffie
Current Estimated Value
Home Financials for this Owner
Home Financials are based on the most recent Mortgage that was taken out on this home.
Original Mortgage
$80,991
Outstanding Balance
$55,350
Interest Rate
4.37%
Mortgage Type
FHA
Estimated Equity
$278,278
Purchase Details
Closed on
Apr 5, 2011
Sold by
Flagstar Bk Fsb
Bought by
Federal Natl Mtg Assn Fnma
Purchase Details
Closed on
Aug 31, 2007
Sold by
Seabolt Linda F
Bought by
Hatchel Danny L
Home Financials for this Owner
Home Financials are based on the most recent Mortgage that was taken out on this home.
Original Mortgage
$132,000
Interest Rate
6.65%
Mortgage Type
New Conventional
Purchase Details
Closed on
Aug 3, 2005
Sold by
Seabolt Linda F, Administratrix
Bought by
Seabolt Linda F
Purchase Details
Closed on
Apr 1, 1995
Purchase Details
Closed on
Jan 1, 1995
Create a Home Valuation Report for This Property
The Home Valuation Report is an in-depth analysis detailing your home's value as well as a comparison with similar homes in the area
Home Values in the Area
Average Home Value in this Area
Purchase History
| Date | Buyer | Sale Price | Title Company |
|---|---|---|---|
| Morgan Duffie | $83,100 | -- | |
| Federal Natl Mtg Assn Fnma | -- | -- | |
| Flagstar Bk Fsb | $109,139 | -- | |
| Hatchel Danny L | $147,000 | -- | |
| Seabolt Linda F | -- | -- | |
| -- | $75,000 | -- | |
| -- | $87,200 | -- |
Source: Public Records
Mortgage History
| Date | Status | Borrower | Loan Amount |
|---|---|---|---|
| Open | Morgan Duffie | $80,991 | |
| Previous Owner | Hatchel Danny L | $132,000 |
Source: Public Records
Tax History Compared to Growth
Tax History
| Year | Tax Paid | Tax Assessment Tax Assessment Total Assessment is a certain percentage of the fair market value that is determined by local assessors to be the total taxable value of land and additions on the property. | Land | Improvement |
|---|---|---|---|---|
| 2024 | $1,817 | $72,520 | $8,120 | $64,400 |
| 2023 | $1,370 | $70,280 | $8,120 | $62,160 |
| 2022 | $1,586 | $60,680 | $8,120 | $52,560 |
| 2021 | $1,573 | $59,120 | $8,120 | $51,000 |
| 2020 | $1,554 | $56,800 | $8,120 | $48,680 |
| 2019 | $1,485 | $53,760 | $8,120 | $45,640 |
| 2018 | $1,465 | $51,386 | $8,120 | $43,266 |
| 2017 | $1,450 | $51,386 | $8,120 | $43,266 |
| 2016 | $1,417 | $51,386 | $8,120 | $43,266 |
| 2015 | $1,428 | $51,386 | $8,120 | $43,266 |
| 2014 | $1,428 | $51,386 | $8,120 | $43,266 |
Source: Public Records
Map
Nearby Homes
- 5993 Overby Rd
- 6025 River Oaks Dr
- 6144 Scott Dr
- 6144 Scott Dr Unit 8
- 5837 Meadow View Ln
- 5867 Meadow View Ln
- 6544 Teal Trail Dr
- 6185 Old Stringer Rd
- 5729 Jim Crow Rd
- 6409 Eva Rd
- 6619 Blue Cove Dr
- 6026 Jim Crow Rd
- 6322 Spring Cove Dr
- 5644 Mohave Ct
- 6376 Spring Cove Dr
- 6024 Park Bay Ct
- 6137 White Oak Dr
- 6135 White Oak Dr
- 6409 Lights Ferry Rd
- 0 Meadow Cir Unit 8296546
- 0 Meadow Cir
- 5958 Overby Rd
- 0 Meadow View Ln Unit 7451143
- 0 Meadow View Ln Unit 8613087
- 0 Meadow View Ln Unit 8267223
- 0 Meadow View Ln Unit 8265332
- 0 Meadow View Ln Unit 7317623
- 0 Meadow View Ln Unit 7426769
- 0 Meadow View Ln Unit 9006725
- 0 Meadow View Ln Unit 7254758
- 0 Meadow View Ln Unit 7256851
- 0 Meadow View Ln
- 5955 Overby Rd
- 5959 Overby Rd
- 5938 Overby Rd
- LOT 4 Overby Rd
- 5963 Overby Rd
- 5998 Overby Rd
- 5917 Overby Rd