Estimated Value: $532,614 - $583,000
3
Beds
3
Baths
2,250
Sq Ft
$246/Sq Ft
Est. Value
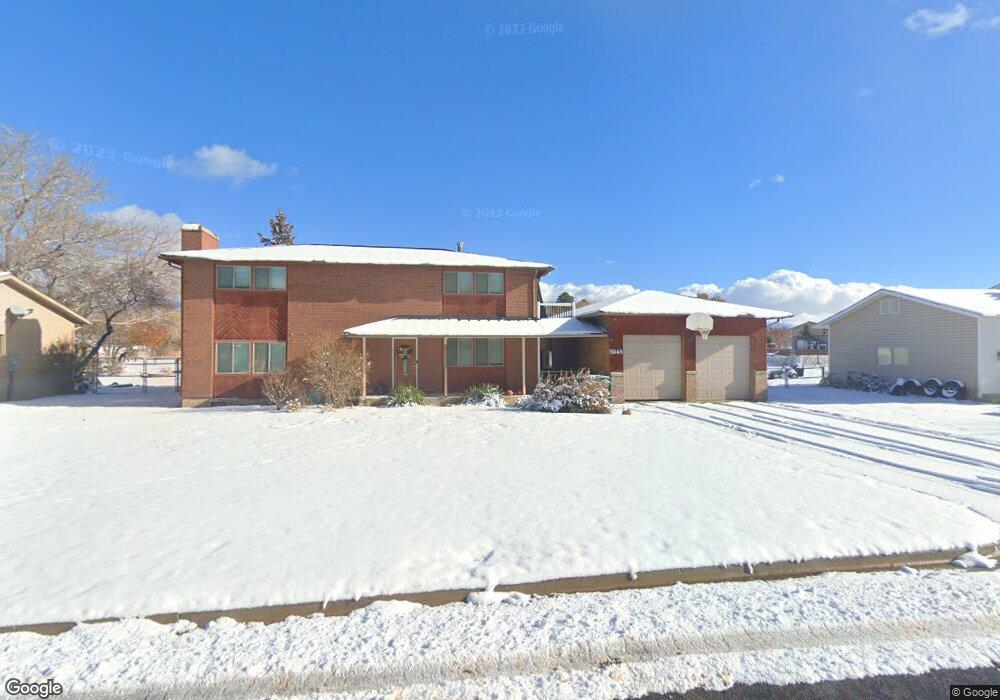
About This Home
This home is located at 5948 S 3650 W, Roy, UT 84067 and is currently estimated at $553,404, approximately $245 per square foot. 5948 S 3650 W is a home located in Weber County with nearby schools including Midland School, Roy Junior High School, and Roy High School.
Ownership History
Date
Name
Owned For
Owner Type
Purchase Details
Closed on
Jun 30, 2016
Bought by
Newman Kyle
Current Estimated Value
Home Financials for this Owner
Home Financials are based on the most recent Mortgage that was taken out on this home.
Original Mortgage
$251,289
Outstanding Balance
$199,955
Interest Rate
3.48%
Estimated Equity
$353,449
Purchase Details
Closed on
Jan 15, 2014
Sold by
Waugh Perry Eugene and Waugh Roberta M
Bought by
Waugh Perry Eugene and Kite Roberta Mae
Create a Home Valuation Report for This Property
The Home Valuation Report is an in-depth analysis detailing your home's value as well as a comparison with similar homes in the area
Home Values in the Area
Average Home Value in this Area
Purchase History
| Date | Buyer | Sale Price | Title Company |
|---|---|---|---|
| Newman Kyle | -- | -- | |
| Waugh Perry Eugene | -- | None Available |
Source: Public Records
Mortgage History
| Date | Status | Borrower | Loan Amount |
|---|---|---|---|
| Open | Newman Kyle | $251,289 | |
| Closed | Newman Kyle | -- |
Source: Public Records
Tax History Compared to Growth
Tax History
| Year | Tax Paid | Tax Assessment Tax Assessment Total Assessment is a certain percentage of the fair market value that is determined by local assessors to be the total taxable value of land and additions on the property. | Land | Improvement |
|---|---|---|---|---|
| 2025 | $2,965 | $468,753 | $149,549 | $319,204 |
| 2024 | $2,895 | $253,549 | $82,269 | $171,280 |
| 2023 | $2,544 | $220,550 | $82,165 | $138,385 |
| 2022 | $2,806 | $252,451 | $68,594 | $183,857 |
| 2021 | $2,457 | $365,000 | $84,794 | $280,206 |
| 2020 | $2,356 | $322,000 | $84,794 | $237,206 |
| 2019 | $2,253 | $290,000 | $54,911 | $235,089 |
| 2018 | $2,039 | $246,000 | $49,896 | $196,104 |
| 2017 | $1,761 | $197,000 | $44,860 | $152,140 |
| 2016 | $208 | $104,904 | $24,633 | $80,271 |
| 2015 | $202 | $102,609 | $21,882 | $80,727 |
| 2014 | $198 | $99,086 | $21,882 | $77,204 |
Source: Public Records
Map
Nearby Homes