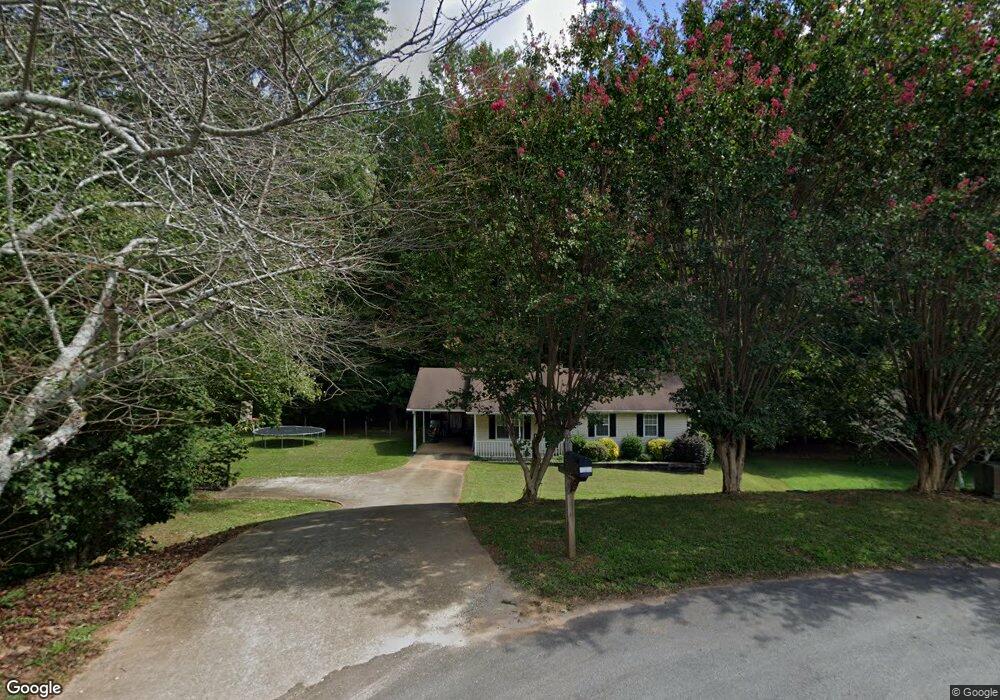
5949 Fieldstone Ct Clermont, GA 30527
Estimated Value: $268,000 - $292,000
3
Beds
2
Baths
1,100
Sq Ft
$253/Sq Ft
Est. Value
About This Home
This home is located at 5949 Fieldstone Ct, Clermont, GA 30527 and is currently estimated at $278,465, approximately $253 per square foot. 5949 Fieldstone Ct is a home located in Hall County with nearby schools including Wauka Mountain Elementary School, North Hall Middle School, and North Hall High School.
Ownership History
Date
Name
Owned For
Owner Type
Purchase Details
Closed on
Oct 24, 2011
Sold by
Federal Home Loan Mortgage Corporation
Bought by
Hung Michelle
Current Estimated Value
Purchase Details
Closed on
Aug 30, 2006
Sold by
Walters William H
Bought by
Walters William H and Walters April M
Home Financials for this Owner
Home Financials are based on the most recent Mortgage that was taken out on this home.
Original Mortgage
$122,042
Interest Rate
6.73%
Mortgage Type
New Conventional
Purchase Details
Closed on
Aug 24, 2001
Sold by
Coley Chad W and Coley Jane W
Bought by
Tyner Brittany E
Home Financials for this Owner
Home Financials are based on the most recent Mortgage that was taken out on this home.
Original Mortgage
$80,750
Interest Rate
7.18%
Mortgage Type
New Conventional
Purchase Details
Closed on
Dec 23, 1997
Sold by
Bonnette Joel M
Bought by
Coley Chad W and Coley Jane W
Home Financials for this Owner
Home Financials are based on the most recent Mortgage that was taken out on this home.
Original Mortgage
$76,321
Interest Rate
7.18%
Mortgage Type
FHA
Purchase Details
Closed on
Feb 23, 1997
Sold by
Bonnette Joel M
Bought by
Coley Chad W
Create a Home Valuation Report for This Property
The Home Valuation Report is an in-depth analysis detailing your home's value as well as a comparison with similar homes in the area
Home Values in the Area
Average Home Value in this Area
Purchase History
| Date | Buyer | Sale Price | Title Company |
|---|---|---|---|
| Hung Michelle | -- | -- | |
| Walters William H | -- | -- | |
| Walters William H | $122,100 | -- | |
| Tyner Brittany E | $85,000 | -- | |
| Coley Chad W | $77,000 | -- | |
| Coley Chad W | $77,000 | -- |
Source: Public Records
Mortgage History
| Date | Status | Borrower | Loan Amount |
|---|---|---|---|
| Previous Owner | Walters William H | $122,042 | |
| Previous Owner | Tyner Brittany E | $80,750 | |
| Previous Owner | Coley Chad W | $76,321 |
Source: Public Records
Tax History Compared to Growth
Tax History
| Year | Tax Paid | Tax Assessment Tax Assessment Total Assessment is a certain percentage of the fair market value that is determined by local assessors to be the total taxable value of land and additions on the property. | Land | Improvement |
|---|---|---|---|---|
| 2024 | $2,239 | $87,720 | $7,840 | $79,880 |
| 2023 | $2,239 | $87,720 | $7,840 | $79,880 |
| 2022 | $1,970 | $73,680 | $7,840 | $65,840 |
| 2021 | $1,770 | $64,680 | $7,840 | $56,840 |
| 2020 | $1,739 | $61,640 | $7,840 | $53,800 |
| 2019 | $1,482 | $51,640 | $7,840 | $43,800 |
| 2018 | $1,326 | $44,440 | $7,840 | $36,600 |
| 2017 | $1,115 | $37,360 | $7,840 | $29,520 |
| 2016 | $1,086 | $37,200 | $4,920 | $32,280 |
| 2015 | $917 | $30,744 | $4,320 | $26,424 |
| 2014 | $917 | $30,744 | $4,320 | $26,424 |
Source: Public Records
Map
Nearby Homes
- 5814 Gailey Dr
- 5519 Cleveland Hwy
- 6223 Hulsey Rd
- 6217 Green Mountain Ln
- 6310 Green Mountain Ln
- 6708 Clermont Hwy
- 5375 Clarks Bridge Rd
- 5367 Clarks Bridge Rd
- 239 Brown Dr
- 5722 Crystal
- 455 Long Mountain Ct
- 6632 Mountain Meadow Dr
- 6421 Holly Springs Rd
- 6552 Shoal Creek Rd
- 5231 Dahlonega Hwy
- 0 Holly Springs Rd Unit 7661867
- 0 Holly Springs Rd Unit 25494296
- 5945 Fieldstone Ct
- 5941 Fieldstone Ct
- 5948 Fieldstone Ct
- 5944 Fieldstone Ct
- 5940 Fieldstone Ct
- 5937 Fieldstone Ct
- 5936 Fieldstone Ct
- 5933 Fieldstone Ct
- 5932 Fieldstone Ct Unit 24
- 5932 Fieldstone Ct
- 5929 Fieldstone Ct
- 5928 Fieldstone Ct
- 5808 Fieldstone Ct
- 5804 Fieldstone Ct
- 5925 Fieldstone Ct
- 5924 Fieldstone Ct
- 5812 Fieldstone Ct
- 5872 Gailey Dr
- 0 Fieldstone Ct Unit 7484710
- 0 Fieldstone Ct Unit 8501851