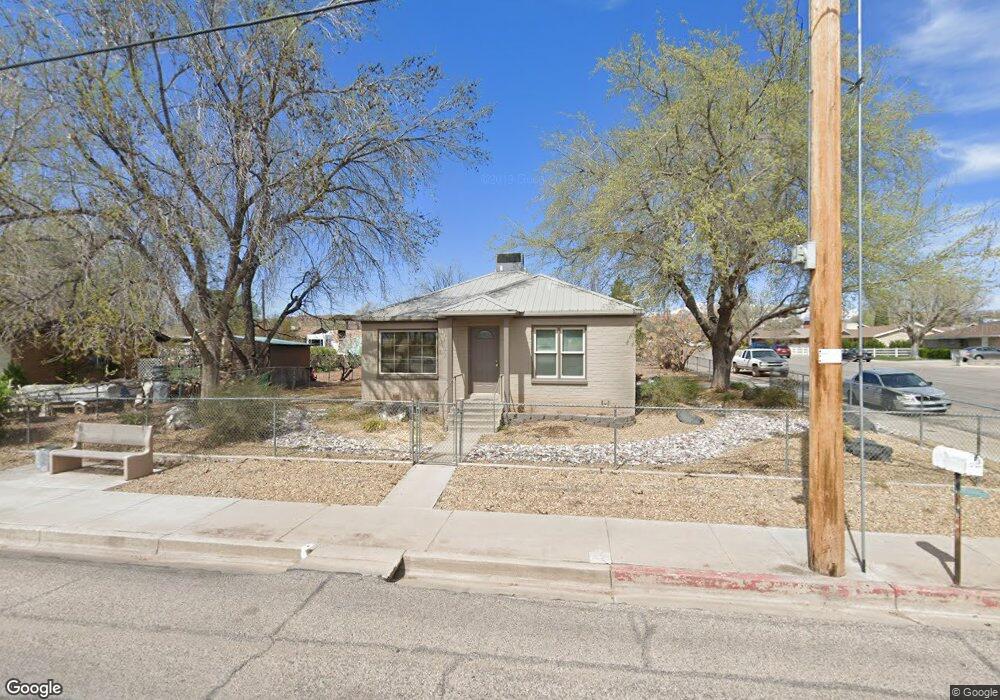
595 E 700 S Saint George, UT 84770
Estimated Value: $289,000 - $403,000
2
Beds
1
Bath
908
Sq Ft
$356/Sq Ft
Est. Value
About This Home
This home is located at 595 E 700 S, Saint George, UT 84770 and is currently estimated at $322,862, approximately $355 per square foot. 595 E 700 S is a home located in Washington County with nearby schools including Legacy School, Dixie Middle School, and Tonaquint Intermediate School.
Ownership History
Date
Name
Owned For
Owner Type
Purchase Details
Closed on
Sep 22, 2017
Sold by
Clay S Llc
Bought by
Sunbowl Llc
Current Estimated Value
Purchase Details
Closed on
Oct 28, 2014
Sold by
Hughes Cory and Hughes Rachael
Bought by
Clay S Llc
Purchase Details
Closed on
Jan 15, 2014
Sold by
Clay Danny G
Bought by
Hughes Cory and Hughes Rachael
Purchase Details
Closed on
Oct 19, 2011
Sold by
Fannie Mae
Bought by
Clay Danny G
Purchase Details
Closed on
Jun 17, 2011
Sold by
Mcdonald Erik and Mcdonald Traci
Bought by
Federal National Mortgage Association
Purchase Details
Closed on
May 11, 2007
Sold by
Mcdonald Erik and Mcdonald Traci
Bought by
Mcdonald Erik B and Mcdonald Traci H
Home Financials for this Owner
Home Financials are based on the most recent Mortgage that was taken out on this home.
Original Mortgage
$54,000
Interest Rate
6.17%
Mortgage Type
New Conventional
Create a Home Valuation Report for This Property
The Home Valuation Report is an in-depth analysis detailing your home's value as well as a comparison with similar homes in the area
Purchase History
| Date | Buyer | Sale Price | Title Company |
|---|---|---|---|
| Sunbowl Llc | -- | None Available | |
| Clay S Llc | -- | None Available | |
| Hughes Cory | -- | None Available | |
| Clay Danny G | $63,000 | Southern Utah Title Of Cedar | |
| Federal National Mortgage Association | $110,674 | Accommodation | |
| Mcdonald Erik B | -- | Guardian Title Insurance Age |
Source: Public Records
Mortgage History
| Date | Status | Borrower | Loan Amount |
|---|---|---|---|
| Previous Owner | Mcdonald Erik B | $54,000 |
Source: Public Records
Tax History
| Year | Tax Paid | Tax Assessment Tax Assessment Total Assessment is a certain percentage of the fair market value that is determined by local assessors to be the total taxable value of land and additions on the property. | Land | Improvement |
|---|---|---|---|---|
| 2025 | $937 | $154,165 | $66,000 | $88,165 |
| 2023 | $1,132 | $169,070 | $44,000 | $125,070 |
| 2022 | $1,165 | $163,625 | $38,500 | $125,125 |
| 2021 | $957 | $200,600 | $65,000 | $135,600 |
| 2020 | $790 | $156,000 | $50,000 | $106,000 |
| 2019 | $778 | $149,900 | $50,000 | $99,900 |
| 2018 | $742 | $71,720 | $0 | $0 |
| 2017 | $636 | $61,490 | $0 | $0 |
| 2016 | $674 | $60,225 | $0 | $0 |
| 2015 | $697 | $59,785 | $0 | $0 |
| 2014 | $1,201 | $103,600 | $0 | $0 |
Source: Public Records
Map
Nearby Homes
- 665 S 500 E
- 464 E 700 S
- 777 S 400 E Unit 45
- 701 E 900 S Unit 40
- 701 E 900 S Unit 41
- 701 E 900 S Unit 33
- 670 E 900 S
- 840 S 400 E Unit 46
- 840 S 400 E Unit 46
- 1037 S 620 East St
- 376 E 300 S Unit 2
- 1050 E S Unit 8
- 841 E 1010 S
- 524 S 200 E Unit 12
- 1050 E 500 S Unit 15
- 197 S 600 E
- 1019 S 900 E
- 453 S 100 E Unit 8
- 433 S 100 E
- 295 S 200 E
Your Personal Tour Guide
Ask me questions while you tour the home.